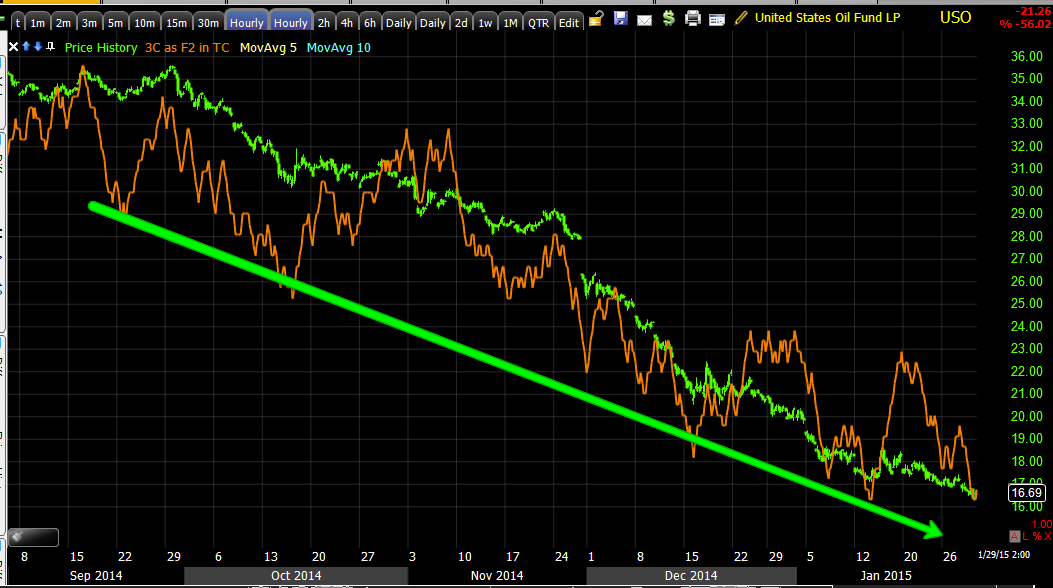
First we'll take a quick look at USO's charts, I still like this one for a bounce that likely turns short squeeze, which means we may have to consider some other possibilities related to such a potential outcome.
USO 60 min with two candles VERY close to a Harami (bullish) reversal pattern, plus the increased volume is common at a reversal area.
This morning's weakness looks to be similar to the averages on this chart, 3C picking up the next day where it left off at the close which was negative, but...
As you see, it looks like that was used to someone's advantage as the intraday 3 min chart is leading positive
As is the 5 min intraday
And the 5 min trend is still very much intact.
Remember, based on these charts that have a positive divegrence out to about 30 minutes, I think we get a surprising bounce in crude, it would seem likely to trigger a short squeeze, but I do not see it in any way as a primary trend reversal, more what I'd call a counter trend rally/bounce.
The 60 min chart shows no evidence of anything other than primary downtrend confirmation, this chart would need a significant base and positive divegrence before I'd even consider a trend reversal, it's not there.
However, even though I don't see much in the Energy (XLE) charts that excites me, it would stand to reason that some of the badly beaten down energy names would trigger a short squeeze, we saw that earlier in the week, I believe Monday as Energy led the 9 S&P sectors and we had a strong short squeeze in Energy stocks, this could of course effect the broader market. I can't say specifically it did on Monday as the Russell 2000 was already forecasted to lead the averages as of Friday's Week Ahead post and the other averages were rather flat, but it is something to consider.
Also worthy of consideration, even though it is early as we have a couple of hours left, the forecast for an oversold bounce from last night (afternoon strength to develop)...
Daily QQQ chart with a bullish Hammer candlestick, almost a bullish Harami or Inside Day as well. I suspect volume will be higher today which would also be bullish.
Just don't forget what those HYG charts looked like, that should give you some ideas of how you can use this as a set up for several different positions whether a piggy back short term long or letting the short trade come to you.
Is interest rates about to start going up?
-
Yes, I know - it does not make any sense - FED is about to cut
rates...but....real world interest rates are not always what FED wants it
to be.
6 years ago


No comments:
Post a Comment