I do see some distribution in to higher prices, perhaps these may be "steering" divergences for tomorrow's max-pain options expiration pin. Typically the max-pain op-ex pin of Friday (weeklies) is somewhere very close to Thursday's close, thus these negative divergences that are seen since we've turned green on the day, may very well be related to max-pain op-ex pin positioning, although the other possibility is the "selling in to any price strength". I tend to lean toward the former over the latter, the simple reasoning is we haven't really sen any price moves that would be significant gains worth selling in to yet.
In any case, here are the charts showing what we've been expecting to happen and what is happening...


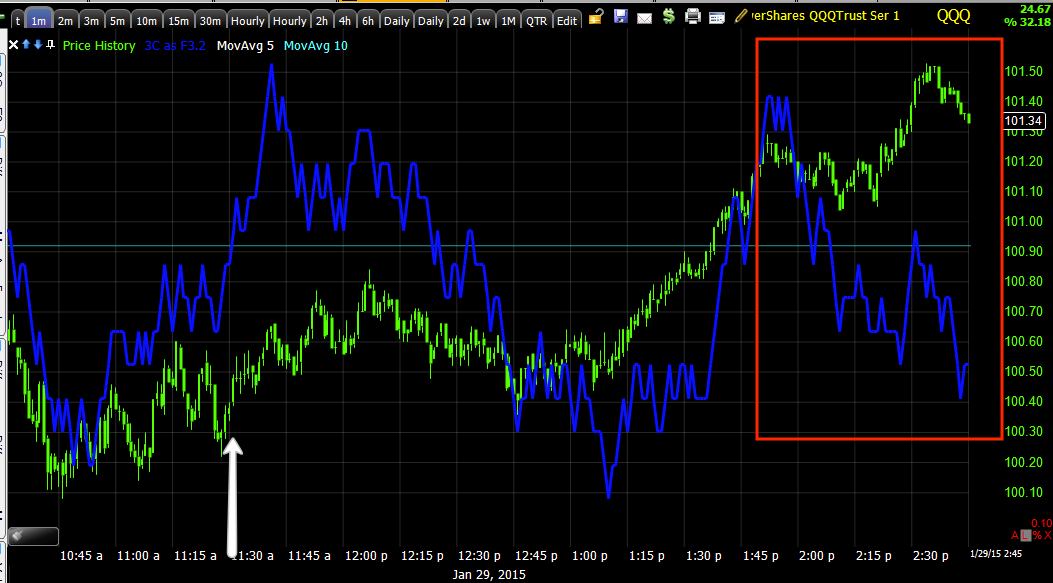

If this negative were to get a lot worse, then I'd be looking at a different scenario of a FAIL of this oversold bounce condition, but we're not that deep in to it yet.


As for TICK...


This is just showing the nature of a capitulation event which is a fractal concept, we see these on intraday charts like this or daily, even monthly, it's good to know what they look like as you'll know what the near term probabilities favor next. Typically volume increases on these oversold events as well.


The point here being that the ramping lever is seeing what appears to be money backing out, no longer willing to take on risk as they likely don't want to get caught long when the music stops and can't find a chair, this acts as a fantastic leading indicator, especially when HYG's price itself starts diverging with the averages.
Right now I think we have a fairly decent handle on the short term action and even the short term cycle that started 1/14-1/16, but there's something more important I'm using some of this downtime as the market is doing what we expected, to look in to.
This is the hawkish F_O_M_C statement and the divergence between that and traders' perceptions as they are pricing the first rate hike out further, for instance the F_E_D Funds Futures are pricing in a 14% chance of a June rate hike where as it was 25% last month. Many "experts" are saying there won't be one this year, however I think the bond market may have insight in the apparent divergence between what the F_E_D has said, is saying and what certain individuals are perceiving.
I don't want to just post opinion, I want to post objective, unbiased evidence, this is what I'm looking in to with Treasuries most specifically.
We had 2 auctions today, a 5 year with $35 bn worth of T's up for auction, the high yield was 1.288%, below the When Issued of 1.295% and below last month's 1.739%. Indirects (foreign bidders) took down 63% vs the 4 auction average of 55%, this was the lowest 5 year auction yield since May 2013 and another strong auction on top of yesterday's 2 year.
The second auction 90 minutes later (today) was $29bn in 7 years, they were a bit different with the high yield at 1.59%, above the when issued of 1.586%, the high yield of 1.59% was lower vs last months at 2.13%. Indirects took down 56% vs the 4 auction average of 50.4%, not as strong as the earlier auction and yesterday's.
It really has been the TLT signals though that have been bothering me the most, I knew I should give them some time and I'm glad I did, but now we should be able to get some information that is truly useful as to what the market is really pricing is vs the talking heads.
The second was a 7 year auction with $29 bn in T's


No comments:
Post a Comment