So I'm very happy with last night's analysis. The indicators worked, I just needed to listen and unfortunately I needed to find the reason rather then trust objective data, but it all worked out, the huge after hours gap was destroyed by the time we got the Retail Sales numbers, which were bad, but as usual, the media finds the silver lining in "ex-autos", but our economy doesn't run on "ex-autos". The consensus was 2, it came in worse then consensus at 5, a lot worse.
This leads us to something else I've been talking about a lot lately, LEAKS! They are everywhere. Last night's analysis and the gamble that there would be no gap up in the face of a huge after hours indication of a gap, was based on the charts showing selling into what would otherwise seem (on the surface) to be a very bullish environment. Why were they selling into this "Fantastic economy, judging by earnings that are out this far?" Because they knew something the rest of the sheep who were bidding up the market didn't and that thing they knew was, that Retail Sales would fall short. Lucky guess on my part? 10% maybe yes, 90%, I don't think so. I have seen this for years, time and time again, whether it's Fed policy directives or Fed surprise announcements, government oil inventories, government policy, monetary policy (anyone recall my long call on the dollar way back in October 2009 about a month before it kicked off a 20% rally and before the administration said they'd support a strong dollar policy?) Or how about the call 1 week before oil's 5 1/2 year uptrend broke, the same week Cramer was telling everyone to buy oil!
PLEASE, DO NOT MISUNDERSTAND, I'm not trying to pat myself on the back and I'm in no way claiming GURU status. I'm a student and I'm simply following the charts and my indicators; writing those indicators is the only thing I deserve any credit for-everything else is just reading them. And in reading them for 4 or 5 years, I've seen time and time again these leaks, these moves that came out of nowhere only to be followed up by a surprise Fed policy announcement. It's simply the experience of understanding, or starting to really understand how the market really works and it would and will turn most of your stomachs. The amount of corruption in the market is astounding and the parties that are complicit in the corruption are very surprising and quite disappointing. Since I've been onto this, I've received emails from floor and former floor traders that have enlightened me as to how things go down on the floor. In one word, it can be summed up as "Betrayal". These guys are out there betraying their own customers for their own economic gain and not the gain they deserve for a job well done.
I really liked the idea of straying from the herd, getting out of the mainstream retail thought patterns and creating Wolf on Wall Street, but I never imagined how appropriate the name would become.
Anyway, enough of the rant. Stick around long enough and you'll see it all for yourself.
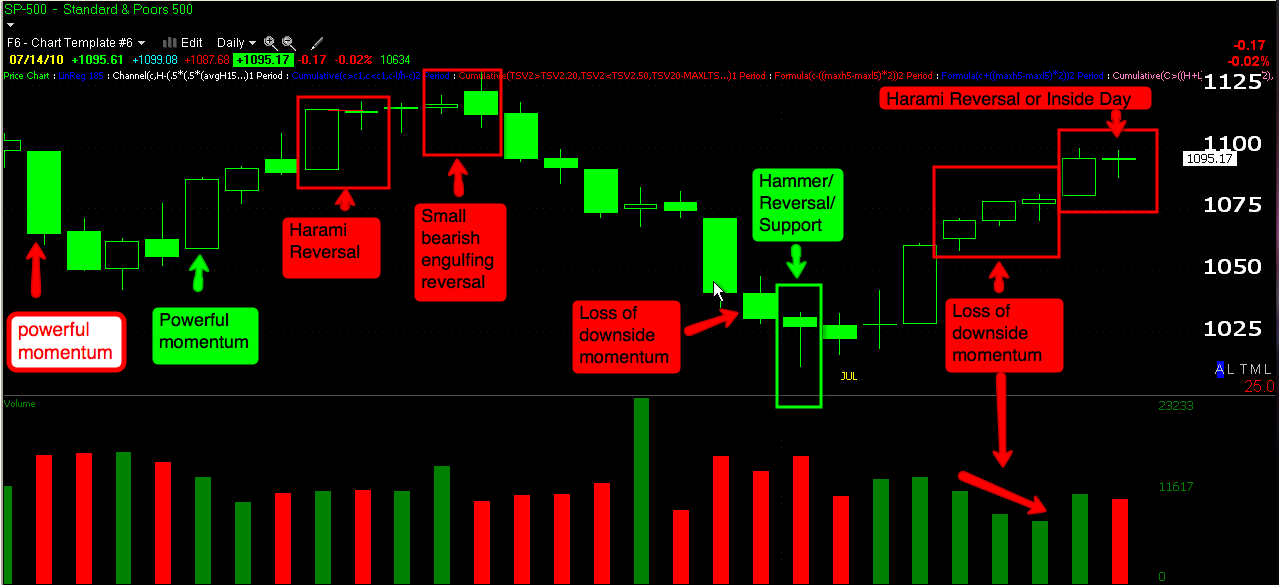
Besides mastering risk management, I really want you guys to focus on the charts I'm putting up, especially the divergences in charts like 3C. Those charts alone will show you how things really happen. People and I, even think and thought that institutional money helped propel bull market's higher with buying, 3C will show you they bought long before and they are selling into strength. One day soon I'll post the 3C and other charts on homebuilder stocks back in 2000-they were under serious accumulation, but very quiet as everyone focussed on the tech melt down. These guys put together huge positions in the home builders several years before they REALLY took off and guess what they did during the entire bubble that was being created? They sold the entire time-for years-in some cases that is how long it takes to distribute a large position.
Now for tomorrow, the idea and keyword is still "patience." Yes, we can jump the gun and maybe make a few extra percentage points, or we can do the responsible thing, we can practice one aspect of risk management and wait for a confirmed reversal before we start taking significant action.
Here are the charts....
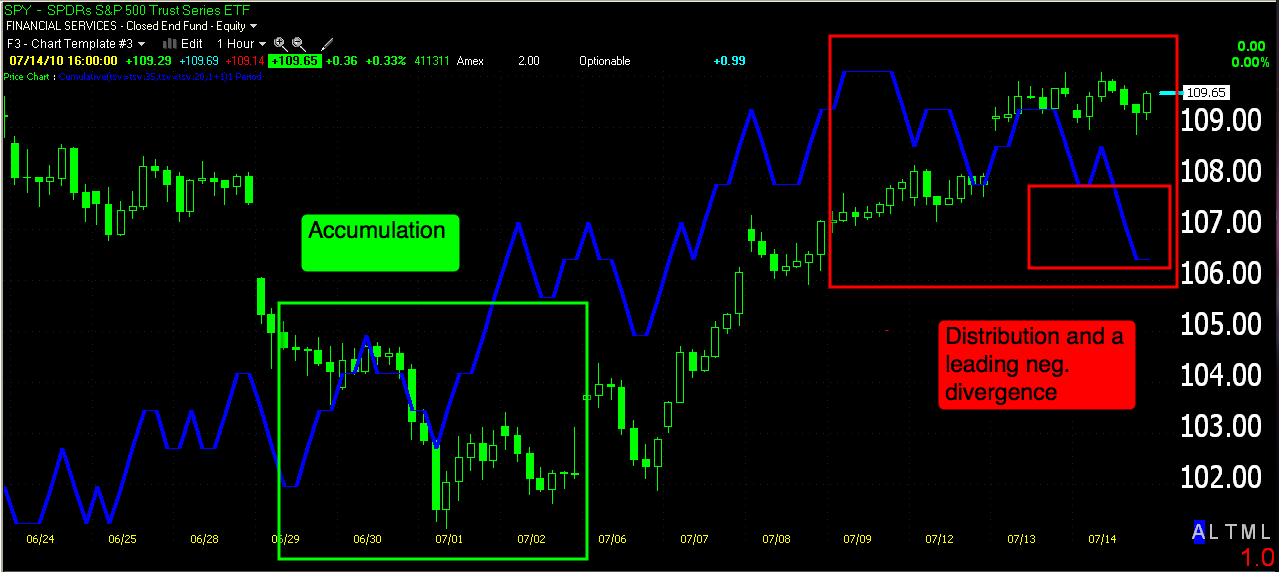
Here's the SPY 1 hour which is the most influential intraday chart showing trends that last weeks or more. This blue indicator is 3C version 3 and in the green box we see accumulation (price makes lower lows while 3C makes higher lows=positive divergence/accumulation, eventual reversal). In red we have the opposite, a negative divergence. Note how price can not escape the gravitational pull of a leading downside negative divergence.


And this one? The QQQQ. Looks similar right? So this is telling us that there's distribution which leads to a reversal. We can still have a bumpy ride, but the big picture here is saying that this rally isn't so strong, in fact it's most likely a typical Wall Street shakeout.


We know that there's distribution on the daily chart, so we turn to the intraday charts to try to pinpoint the exact point of reversal. Right now this 3C version 3 is showing a leading negative divergence, suggesting the bounce in BAC (largely moving with the market "A rising tide lifts all boats") is just about done. Look at the last negative divergence on the left and how it led to a reversal (red arrow) and the positive divergences that led to the bounce (green arrows-cause and effect are very easy to see). The difference now is that the daily chart is in much worse shape. I have a feeling this is the last time BAC will be above that support level that has been in place for 11 months and that makes this a stock worth considering as a key short, but WAIT for confirmation or ease into it for risk management's sake!
And AMPL! It's been a rough ride with the volatility in this low priced stock, but I've maintained my bullish view on the stock for one reason only, here it is....

This daily 3C v.3 chart is in a monster leading, positive divergence. This stock has been under accumulation for awhile and on a day that the market was lackluster, it gained 7+%-I said I liked it as recently as last night and has been featured here for several weeks. This is a great pattern and it may pullback, but I think it has several months of rally in it judging by the amount of accumulation-and this in a poor market overall!
So the plan is the same, be patient-if you are new, take a look at some of the shorts we are using on the June list including June 2 or 3rd (I think 3rd)-it has ETF's that cover all the major disaster groups, but mix in some straight up shorts as well. Past articles will explain why.
Be patient, wait for confirmation before swinging for the fences. Many of you who have been here for awhile already have your position in place, it's just a matter of managing the trade at this point. For the new members, when the SPY is back below $104.40, we expect to see a viscous drop and I personally want to be 75% short at that point (and already am), then save at least 25% in cash for opportunities and possible hedging.
I'll update in the a.m. If you do not receive the email updates, please email with the address you want them sent to. Have a great rest of the week.


No comments:
Post a Comment