We must also plan for contingency scenarios, the more you can imagine and how you will react to them, the better off you will be. There's only one time in which you can plan without the burden of the emotion of a trade which hurts our objectivity, and that is before the trade. Sometimes we forget that the market is like a child, it over reacts in both directions so when you first enter a trade, it is usually a decent idea to give the trade a wide enough stop for it to work, it may take days or weeks. You must also consider the time factor, a trade that hasn't done anything in months is pure opportunity cost because there's a train every minute on Wall Street.
So when taking on wider stops, which can be tightened once the trade moves in your direction, according to the risk management that I have provided you with, it also requires you take on fewer shares. There's no use in having a big position with a tight stop as you are more likely to get stopped out-even if you are right on the trade-remember the market's temper tantrums.
Looking at the chart and 3C (tonight at Trade guild you can see a closer section of where we are compared to the last H&S pattern in 2008 and on a relative basis, we are at the same spot, which is to say very close to the end which saw the market plunge 50%) I can not tell you honestly that I have a bullish bias at this time. There's simply too many pieces of the puzzle that have fallen into place. This doesn't mean this market won't go higher (see the section at Trade guild's post tonight about the false breakout in the wedge) and set a potential trap. OR perhaps it ruins this H&S and starts a new trend up, all I can say is that this chart of the 2009 rally showed very obvious signs of accumulation.

Now, it is essential that you read and understand the risk management concepts. I am going to work on a calculator that will be linked to the site that helps you determine a number of shares that are appropriate while following risk management principles. I do believe and have believed even before we broke down, that this market will see lows that will astound you. I believe we have a very good chance of entering a secular bear market, but I reserve the right to change my mind just as smart money may change theirs. We work with what we know now. I try to be objective as possible, but we do have to make some assumptions when we see a chart like this, the same as I did when the rally of 2009 took shape early on.
So I'll be listing more trades, they will have a bias to the short side because that is what I see the most of, but any good trade, long or short I will list for you. Please just make sure you are familiar with the risk management concepts.
The TRIN closed at 1.41 which leans toward a bullish close tomorrow, but is not in the range where I would say it is highly likely, just there's a bias toward that as of tonight's TRIN. The volatility index is still within the 22 area, which is low enough to spark a decline. At these levels a new leg up rally is unlikely.

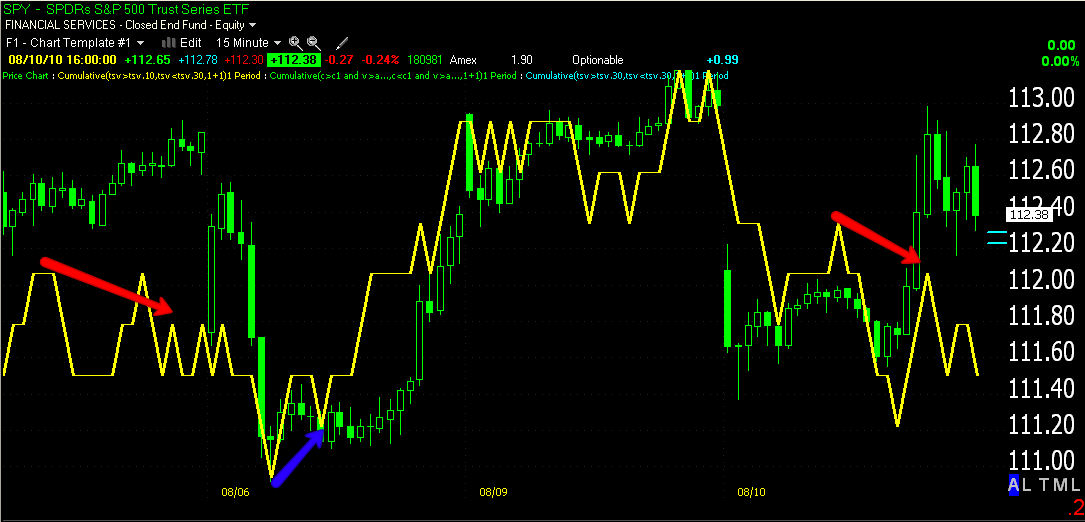
The 3C chart below is the one I find most useful in calling the next few days, it is a 15 minute timeframe and is certainly a period in which institutional money almost exclusively moves. It's too long to show market maker activity.
As of now, indications are for a lower start, but those can change quickly with the overseas markets. So, I'm going to continue to use limit order trades, several triggered today and market orders where appropriate. I'm running scans now so the candidates will be up shortly.
As always, if you have questions, please email me. I'm not getting emails about risk management which i hope means that everyone is clear on the article I have linked on the site. I hope it is not because it is being ignored. This is your ticket to success in the markets, the better you are with risk management, the quicker you will accumulate wealth in the market.
Have a great night and don't forget to read my piece on Today's Fed Policy analysis.


No comments:
Post a Comment