BAC (Bank of America) position is a short. Recently there was a nice bounce that remained under the Trend Channel I use to set stops for trending trades, which BAC seems to be. The current stop from the Trend Channel would be around $12.93, but it moves down with the trade. If you are not using TeleChart or StockFinder then you probably do not have my Trend channel indicator. A rough approximation of it would be a 22 day moving average.


MSPD as a short position. This has been one I've liked for a while now. The stop I'm using here is at $6.82. The LIMIT order is below< $6.25 There's an alternate situation for those with a longer time horizon/greater risk tolerance/excellent risk management. This would be to short some of the position, maybe up to half of the intended size on any rally/bounce near the $7.00 level with a stop around $7.15 and then add the rest of the position as it breaks the limit order on a drop below $6.25.

TMV (Long) This is a position I presented before, I put up a post showing a possible pullback and an opportunity to go long on that pullback. The stop is $39.79 and the Entry is on a pullback to the 10-day moving average. There are two possible stops I like using my Trend Channel indicator. One would be at $39.79, but it moves up every day more or less as TMV remains in an uptrend. If you don't have the Trend Channel, a 22 day moving average is a close approximation. The second stop would be a bit longer term at $37.41, again a 22 day moving average on a two day chart is a close approximation of the Trend Channel.


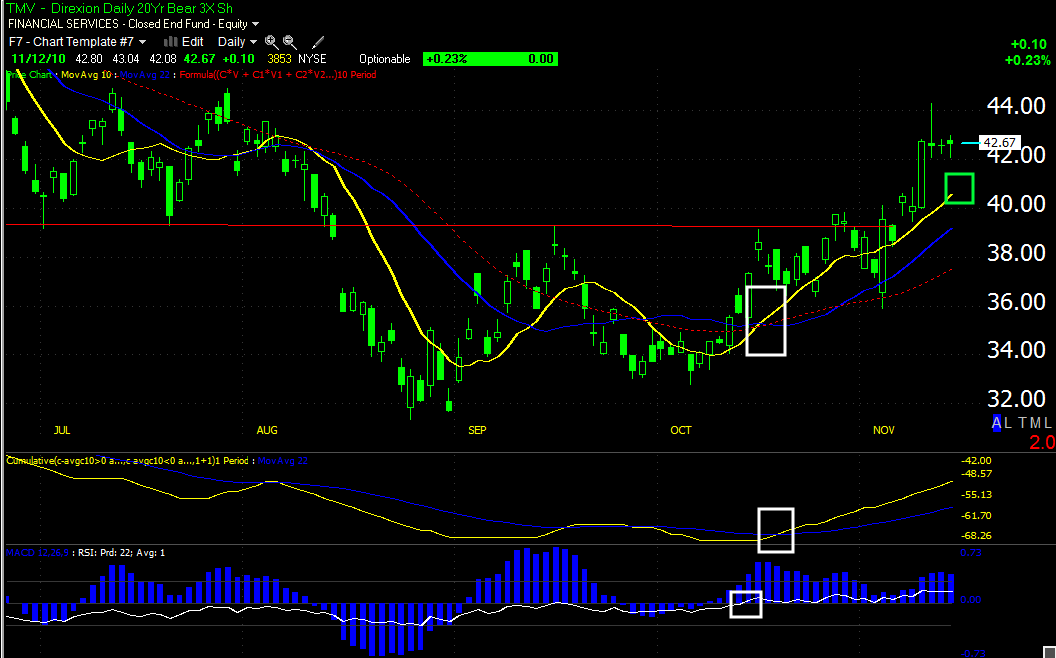
This is the entry screen I like to use for moving average trades as it has 3 conditions that must be met to weed out false crossovers or whipsaw action. The entry in this scenario is at the 10-day moving average which is the yellow line in the price window.
These are ideas, if you like any of them, you may want to adjust them to your own personal style of trading or risk tolerance.


No comments:
Post a Comment