DIA 1 min mostly lateral, not showing much
DIA 5 min showing deterioration although you probably could have guessed at that based on the lateral movement or range bound market after the gap this a.m.
DIA 10 min is about as far as one day will influence and there's not a lot of influence here as it is mostly lateral after retreating a bit from the opening highs.
QQQQ 1 min shows a couple of small negative divergences leading to some downside moves, the lateral arrow at the bottom, if pierced would put this chart into a leading divergence. If you compare these charts to the ETFC trade I posted earlier, you can see what really good confirmation looks like.
So in essence there's deterioration here, but nothing huge unless/until the indicator moves toward a leading divergence.
The QQQQ 5 min has shown some deterioration as well.
The QQQQ 10 min has shown deterioration, but much like the 1 min chart, a break below the the lows would be important.
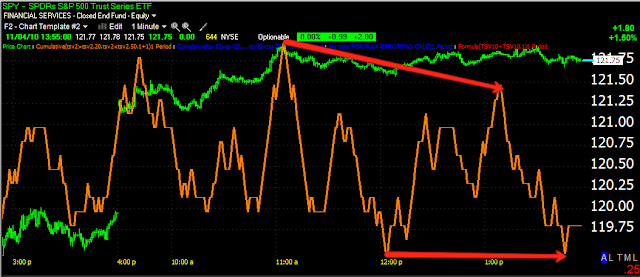
The SPY 1 min chart looks a lot like the others and is in the same situation regarding a possible leading divergence which would be a strong signal.
The 1 min weakness has, like the others filtered into the 5 min chart, again, the issue of breaking the low of today would put in a strong leading divergence signal.
The 10 min SPY is in a relative negative divergence, there's no confirmation here, although 3C did move up before it went into the last divergence. This chart may show something bigger though regarding relative divergences as 3C is not making higher highs, but lower highs in the SPY.
Is interest rates about to start going up?
-
Yes, I know - it does not make any sense - FED is about to cut
rates...but....real world interest rates are not always what FED wants it
to be.
6 years ago


6 comments:
If you look at the charts just using Bollinger Bands, it appears we'll have a pull back within the next couple days. Maybe a chance to cover some shorts unless there's a trend change.
Also, for such an impressive breakout, there's not much volume.
Th breakout is based on about a 90% correlation to the dollar which was up huge overnight. It has moved up most of the US session to break through it's first resistance zone, although the correlation with the market isn't following through which most likely has to do with the below average POMO ratio in today's operations.
I've mentioned the Fed Effect numerous times, yesterday we didn't see one, but it's usually a very wild move to one direction or the other. In watching them for a long time, I can not remember the last one that was not reversed within a few days, sometimes the same day. It would seem that there's an initial knee jerk reaction and then some thought is given to the implications and a reversal ensues. However, I think it is more about the game board being set up.
actually the dollar was down huge last night, I misspoke in the first sentence.
If I look at a daily 3C chart of SPY or QQQQ I see no reason to be short since 9/1. What I don't understand is why care about 1 min, 5 min, 10 min or 1 hour when the daily chart really shows no negative divergence. The lower time frames are likely helpful for day trading but for swing trading I don't think they are. I have gone short based on the 3C lower time frames, as recommended here, and have been taken to the woodshed on most of them.
Anon, are you trading market etfs? There are a lot of excellent stock plays out there and those trades are working well. With risk management you have an excellent opportunity to make money.
When I see a divergence, I often will say you may want to start building a position, it's up to you, but I do not recommend filling out a position until you have real price confirmation in hand. Trying to catch tops and bottoms is risky, wait for the confirmation and look at the individual stock trades. While the averages are up, there are numerous stocks in downtrends, they aren't the object of manipulation.
As far as the shorter charts, that's where moves start and I was asked today to put them up as people want to see what they look like considering tomorrow eco-reports.
The only ETF I purchased was FAZ and I will be stopped out on that today. The other trades that have bombed were mostly stock shorts as listed here.
Post a Comment