Earlier I posted the negative divergences that made me believe these were false breakouts, each one was breaking out above a level of some technical significance, some more then others such as the QQQQ
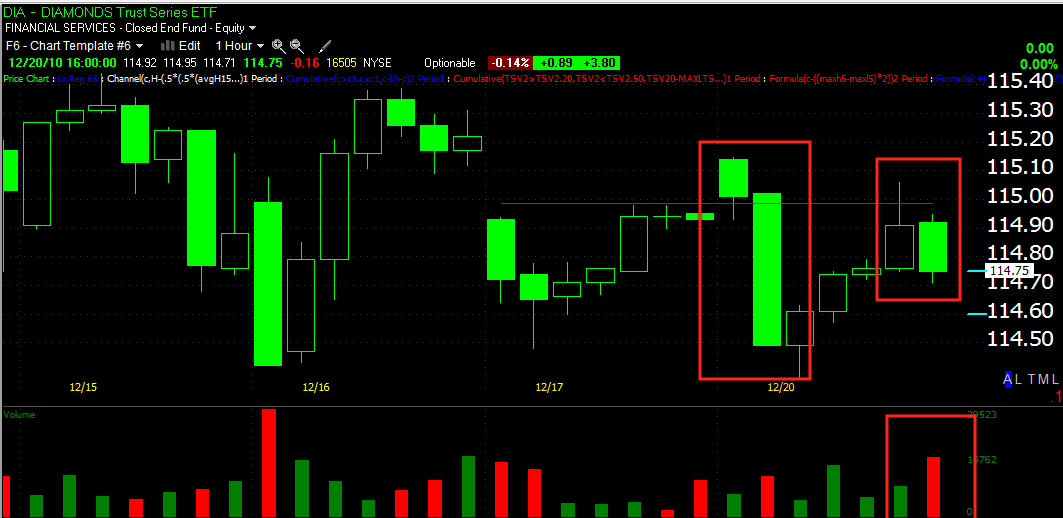
DIA shows 2 recent examples on the hourly chart, today's is the second red box. The technical level of significance here is resistance at a gap-both failed the breakout, note today's increasing volume on the failure.
The QQQQ's were trying for a breakout high, it also failed-again see the 3C divergences posted earlier. The second or last bar is the failure on increasing volume.

Here the SPY was trying to take out a resistance level that has held a couple of times, again the last bar on the hourly chart shows the failure on increasing volume. Given some more time, we'd likely see a move to the downside. We still may get that tomorrow.
The SPY and DIA are trading down significantly in afterhours.


No comments:
Post a Comment