As you may be aware, we were looking for a pullback in USO, nothing bearish, just a normal correction.
Here was one of the targets, so we have hit it. I also had a secondary target closer to $40. Whether this is it for the pullback or not, I' not quite sure, in the bigger picture I don't think it matters much, but there is some evidence to suggest this may be it for the pullback and USO is getting ready to try to break the March highs.

The 15 min pullback reversal signal and a current positive relative divergence.
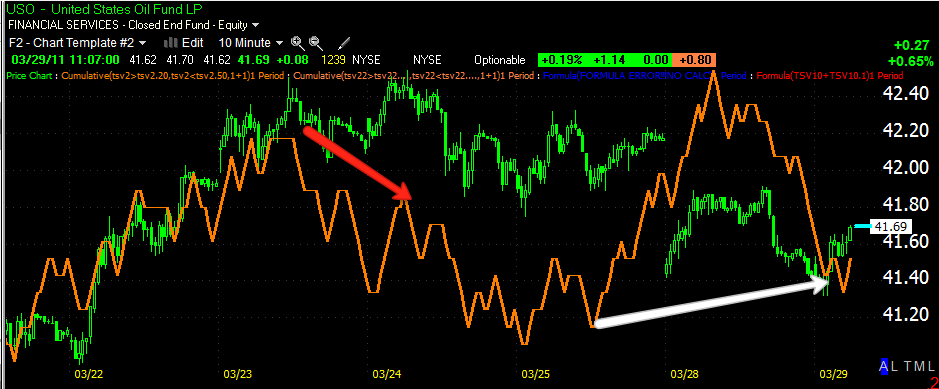
Same thing on the 10 min chart, except a bit more defined.
Ditto for the 5 min chart.

And some accumulation between late yesterday and early today which is moving USO higher.
From the evidence and initial targets published last week which have been hit, I have to assume the probabilities are highest that the pullback, which was not expected to be a big deal, is over.


No comments:
Post a Comment