Cat daily chart/top -the red line below is the target for the top once the market breaks down.
CAT 30 min 3C chart shows a respectable positive divergence lifting CAT about 5 points.
There may be more upside with the 30 min divergence of that size, but right now the 15 min chart is negative, which suggests this should pullback. It could also be the start of distribution, which can go on awhile longer with the negative divergence growing worse into higher prices. In either case, it's close to the top's resistance zone. This may be the type of longer term perspective position that you scale in to.
Again, CAT at resistance and ADX on the 15 min chart has turned down from >40 suggesting the uptrend in this timeframe is coming to an end. If this were to be a true reversal and not just a pullback, I'd expect to see a push through resistance on a false breakout, that would be an excellent timing signal. For those thinking of trying to play a swing trade here on a pullback scenario, you might use the resistance as a stop.
There were some attempts at accumulation that basically just sent DE laterally, they were not good divergences and never entered a leading status. To the right of the vertical line was the second round of positive divergence/accumulation sending DE higher. This 30 min chart still looks pretty strong.
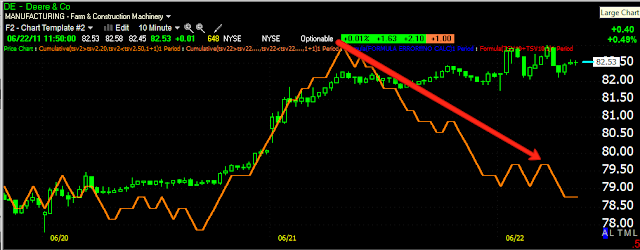
However, like CAT and like the market, the 10 min chart is suggesting at least a pullback, if this is not in fact the start of real distribution. There's two possible trades, a swing trade on the pullback theory, or scaling in to a longer term position for when the market breaks down.
ADX has also turned down from 40 suggesting the short uptrend is coming to an end-DE is also at resistance.
For a longer term short, I'd like to see a failed breakout, for a swing move down for a correction (as the 30 min chart is still strong), then resistance in the area would serve as my stop.
If you have questions about either specific to your trading style, feel free to contact me. In the long term / big picture, both charts look horrible.


No comments:
Post a Comment