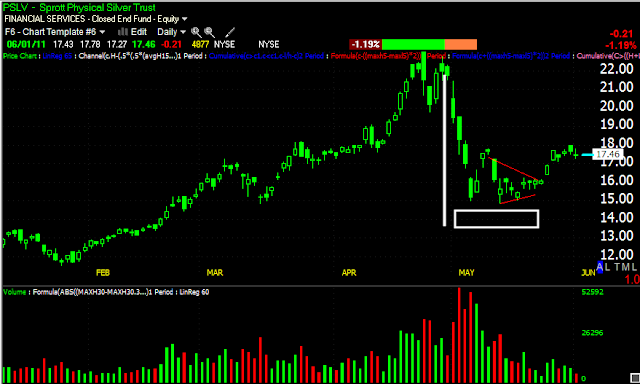
I told you I'd take a look at silver so here it is...
The daily chart I think has to be respected. This is a bear pennant, similar to a bear flag. The implication for the daily chart is a negative continuation pattern, meaning more downside. If I use the standard measuring/target implications, this chart suggests a drop in PSLV to the $10 area, which is pretty hard to believe, but that is the pattern implied target. The thing about the breakout is the same old Wall Street game, it's a pattern that is inherently negative, so traders would expect a break down, not a move up, the move up could very well be our shakeout/head fake.
Here's the negative divergence at the test of the highs, then a positive divergence formed in the pennant, which was solid as it did breakout, but, the 60 min chart is starting to look bad, the shorter charts should look worse...
The 30 min chart, looks worse with a clear negative divergence.
As does the 15 min chart.
If I'm a holder of silver right now, I don't really care too much about what Silver does today or tomorrow in the way of upside, there's no strong edge left on this chart and for me, no reason to continue on with the trade. A few extra percent of upside simply isn't worth the risk these charts are displaying.
As for Gold, I made my opinion on that pretty clear last night, I think it' time for a shakeout, however in that there may be a very good opportunity that only coms along a handful of times each year. Today's strength in gold is most likely a flight to safety trade and/or concerns over inflation with the recent chatter of interest rate hikes.
Is interest rates about to start going up?
-
Yes, I know - it does not make any sense - FED is about to cut
rates...but....real world interest rates are not always what FED wants it
to be.
6 years ago


No comments:
Post a Comment