"So here's my take, everyone was expecting a bounce on the done debt deal, the trade was too obvious, after the House passed the legislation, the debt deal was too obvious."
What the market is really worried about is a downgrade and tonight Moody's passed on a downgrade, although they did put out a negative outlook which they had to do to keep any credibility."
Fitch also left the U.S. credit rating at Aaa, this was a big fear in the markets. China's Dagong rating agency did downgrade US sovereign debt, but the move was already widely expected last week and Dagong is not taken seriously by the market as this was most likely more of a Chinese political statement.
"Today some serious levels were taken out, these are the kinds of levels that send traders into the market on the short side."
"Today some serious levels were taken out, these are the kinds of levels that send traders into the market on the short side."
I highlighted many of the levels in the various averages last night, many are focused on the break of the 200-day moving average. However, as I often point out, Wall Street has adapted to Technical Analysis, Technical Analysis has not adapted to Wall Street. Statistics going back over a hundred years in the US and about 400 years in the British stock market show that shorting a break of the 200 day moving average and buying a break above the average use to produce gains that beat buy and hold by a wide margin; that all changed around 1990. As the Internet revolution came and cheap online brokers, more people started using technical analysis and the 200-day moving average and the "Death Cross" have become a widely used indication in the markets. There's little evidence to back up the use of the break of the 200-day in characterizing bear markets. In fact, as I used to teach in my classes, the most important signal the average gives has nothing to do with price or the 50 day average crossing it, but instead the slope of the average.
Here are some examples...

Here we see multiple touches or breaks of the 200-day at the red arrows, however, the real power of the 200-day remains in the slope (as denoted by the white arrows).


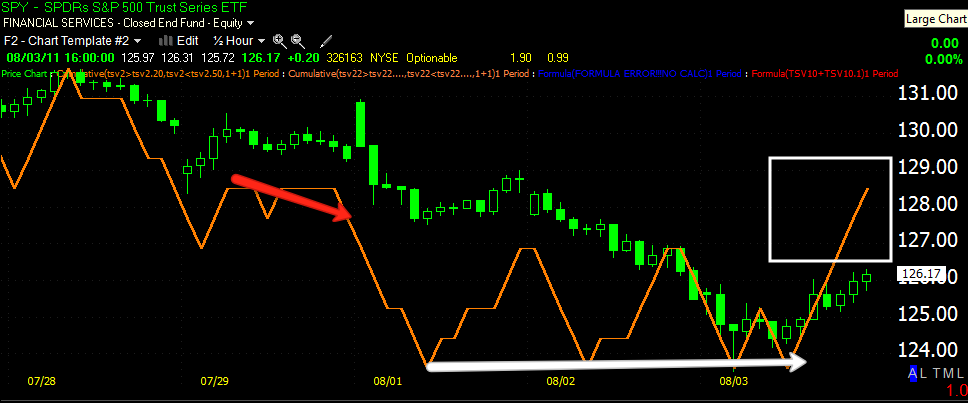
"this is a possible head fake move as well, with all of the important levels broken, there's going to be a large short presence, a perfect setup for a head fake. You can see the last head fake in the SPY on a new high, they tend to be at extremes."
Here's an example...

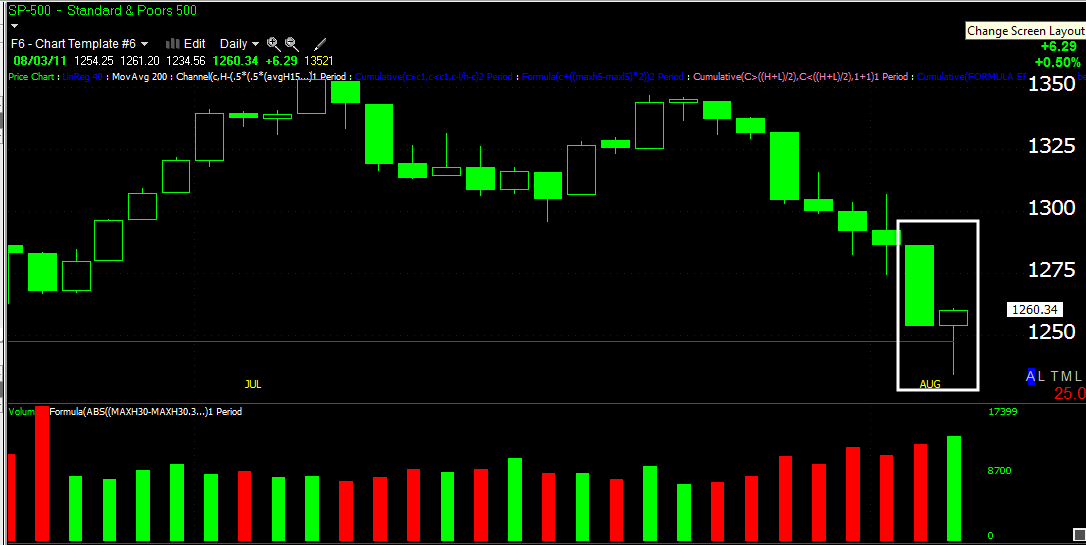
The July 7th break above defined resistance plays on traders' propensity to buy new breakout highs and short new break-down lows. This traps traders in losing head-fake positions. Today the market took out the March support level, shortly thereafter the market put together an impressive intraday rally. Within the first hour of trade the Dow-30 was down 165 points, it closed up 29 points, putting in a 194 point rally off the intraday lows. Also at the white arrows, large volume tends to come at reversal points as the volume acts either as a mini-capitulation or is a form of churning with retail shorts providing Wall Street with long positions as they take the other side of the trade. Today's volume for the NYSE composite came in 39% higher then the year to date average. The NASDAQ Composite's volume was 32% higher then the daily average volume. I think the evidence of intraday trade shows that massive churning took place today.
Surprisingly, there were no dominant Price/Volume relationships today.
"If a head fake plays out, I would expect the market to open lower and probably sell-off a bit more committing shorts to the move. I'm not basing my analysis on an oversold move because there's no way to define oversold, I'm basing it on 3C charts that seemed to defy new lows and made higher highs. Also the Price / Volume relationship came in at Price Down/Volume up, this is a typical short term reversal relationship on short term capitulation."
The ADP jobs data gave us an even better set-up then what I had proposed last night coming in at +114k on consensus of +85k (The BLS reports for last month Friday) , the market gapped up on the report, which gives shorts a better entry, which they obviously took as the market fell to its intraday low within an hour. Also the break of the March support brought more shorts into the market.

The following quote from last night played out as expected.
"I'll be keeping an eye on the early trade, but I would expect the morning to look pretty nasty, it makes sense just from a head fake point of view, you need traders to commit to the short."
The heavy volume from 10:36-10:46 failed to produce a new low, this was churning and what I said I'd be on the lookout for. 3C showed signs that that churning was under accumulation, as did subsequent price action.


The IWM
The point of a head fake or false breakout/breakdown has multiple uses, one is Wall Street, which normally accumulates quietly and over a longer period of time, can accumulate openly as they are simply taking the other side of the trade, no one suspects anything. The second reason is to trap traders at unfavorable levels. In this case, a move higher in the averages will put those traders who shorted the break of the March support in a losing position, as the average moves higher they are at a greater loss, which causes short covering and that buying causes more demand and higher prices, this s why false breaks often result is fast and powerful moves n the opposite direction of the break, you can think of it as a short of bear trap.
Here's another interesting chart...

This is the recent downtrend on a 15 min chart of the SPY with Volume-at-Price. Note today's green volume was the highest of the entire trend down (white vertical reference line).
Also my crossover screen, which uses 2 additional indicators to prevent false crossovers or whipsaws (the additional indicators are RSI above 50 for a long on a price crossover and a custom proprietary indicator that needs to cross its blue moving average for a valid signal).

Today was the first valid crossover on a 15 min chart of the entire downtrend as you can see, my custom indicator (yellow) in the middle window, refused to confirm any of the previous price moving average crossovers until today, RSI was also above 50 (the 3rd condition).
In another interesting signal, FXF, the Swiss Franc saw intervention during European trading hours by the Swiss National Bank, the intervention was short lived as FXF quickly moved higher as a safe haven trade.

The FXF (ETF for the Swiss Franc). Green arrows=confirmation of the price trend, the red arrows are negative divergences and the red box is a leading negative divergence-the most powerful divergence.
Also lending support to the market was the drop in the US dollar through the inverse correlation with the market. Tuesday I posted this piece showing negative divergences in UUP (proxy for the Dollar Index) and confirmatory positive divergences in the Euro. Today the dollar dropped and remains in a negative position.

30 min 3C chart of UUP (white=positive divergence/accumulation-red= negative divergence/distribution). There was a 1 min end of day positive divergence in UUP and some 1 min negative divergences in the market averages so I wouldn't be surprised to see some early weakness, although the 5 min charts (which are more important) are positive. The 30 min chart is even more important and has a leading negative divergence so I expect the dollar to fall even more, which can lend support to the market. The late positive divergence may very well have had to do with the BOJ's intervention in the Yen. Remember, we are always behind the information curve and this intervention will not come as a surprise to many.
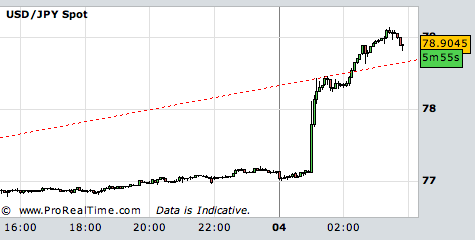
BOJ Intervenes on behalf of the Yen sending the Nikkei higher.
As for internals and sectors today, it was a fairly strong day, with only 6 of the 30 main Morningstar Industry groups posting a loss. Of all 239 Morningstar Industry and Sub-Industry groups, only 66 closed red.
The major averages closed near the highs of the day and posted some bullish reversal candlestick patterns.


XLF (Financials) forms a bullish hammer and a bullish Harami reversal formation
As for Gold/GLD


The 15 min chart still indicates the probability of a pullback in GLD.

The more serious daily divergence in GLD.
It should also be noted that silver saw a margin hike today by Interactive Brokers. The drama continues or perhaps is starting anew.
Here are the most important 3C charts for the majors...


Here's the intraday 5 min divergence that sent FAZ below support, although there were hints this would be a false breakout at the time it broke out Tuesday.
I think today's moves were impressive, especially considering the miss in non-manufacturing ISM earlier in the day, the market shook it off.
Other news included, "Former top Fed official Donald Kohn tells WSJ's Jon Hilsenrath he expects the Fed to give "very serious consideration" to a new round of bond purchases if it determines after the Aug. 9 FOMC meeting that the recovery is really losing steam and if inflation is coming down"
I believe these continued and more powerful divergences are telling us to expect quite a move up, however, as many of you know, I consider the rally of the last 2+ years to be a cyclical bull market within a secular bear market. I would like to see a nice bounce and head fake to short in to strength, but ultimately I think the next shoe to drop will be the big one.
Here are just a few reasons I feel this way.


NASDAQ 100, another horrible divergence with a leading new low. Ultimately the artificial prop of Quantitative Easing has created a house of cards and when it comes crashing down, I do believe we will see a true, long term secular bear market.
As for the Miners System...The DUST trade was stopped out on the 3% stop-loss rule. There are no current trades.
As for After Hours earnings reports:
ATVI blew out earnings and raised full year guidance, trading up nearly 2.5% in AH
PRU profits fall again, but still beats consensus-trading up about 1% in AH trade
TSLA posted a net loss, but just beat out consensus, trading down -1.3% in AH
PXD beats, trading up +.50%
WFR beat consensus, but cut outlook-nearly unchanged in AH trade
MDR missed consensus and is trading down nearly -2% in AH
ZIP beat consensus and is trading up nearly +15%
CAR Avis beat consensus and is trading up about +.75%
HOTT beat consensus and is trading up 2%
ZUMZ missed big time and is currently behind the woodshed in AH trading down -13+%
LEAP disappointed and is down about 5+% in AH


No comments:
Post a Comment