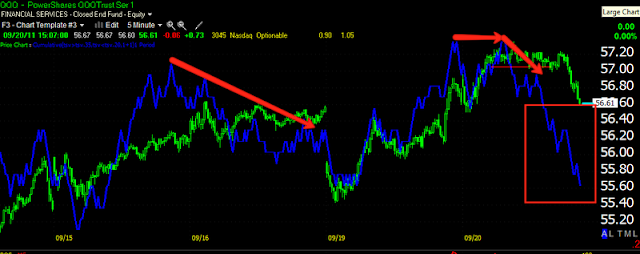
Here's some pretty surprising charts.
DIA 5 min leading negative divergence and DEEP.
DIA 10 min leading negative divergence
DIA 15 min leading negative divergence
DIA 30 min leading negative divergence!!!
IWM 5 min leading negative divergence, also very deep.
IWM 10 min leading negative divergence, also very deep
IWM 15 min relative negative divergence
IWM 60 min leading negative divergence-this is very negative.
QQQ 5 min leading negative divergence
QQQ 15 min leading negative divergence
QQQ 30 min relative negative divergence-this is a very long timeframe.
SPY 5 min leading negative divergence
SPY 10 min leading negative divergence
SPY 15 min leading negative divergence
SPY 30 min relative negative divergence
When I talked about my theory for this week and the Fed, the important part of seeing a positive divergence build in to the FOMC tomorrow would be a fast drop that is quickly accumulated, that wasn't something 3C could tell us, that was something I thought would need to happen to show a positive divergence in time for the FOMC. However, today seems to have been part of the top (yesterday as well) and we have some very significant timeframes that are negative-30/60 min as well as very nasty leading negative divergences. If we didn't have FOMC tomorrow, I would say including todays action, we'd need at least 3 days minimum to see this move bottom and turn to an up cycle. So this has definitely put a monkey wrench in what I hoped to see. In addition as shown earlier, this is one of the biggest distribution areas, is the biggest, in the entire flag.
So I'll be holding my shorts a bit longer unless we get a huge drop and trying to make some sense out of whatever signals lie ahead.
Is interest rates about to start going up?
-
Yes, I know - it does not make any sense - FED is about to cut
rates...but....real world interest rates are not always what FED wants it
to be.
6 years ago


No comments:
Post a Comment