DIA
DIA 1 min was negative right off the open, around 11 a.m a positive divergence and currently a negative divergence for intraday movements.DIA 5 min showed problems yesterday, the gap up today was also negative right at the open, again a positive divergence around 11 a.m. and currently negative-this effects the intraday trend, but a bit longer then the 1 min chart.
DIA 10 min shows a negative opening gap and in line status.
DIA 15 min reflects the negative opening gap, the same 11 am positive divergence and the same negative divergence now, this is a close up view.
DIA 15 min The wider view shows a lot longer term trouble here.
DIA 30 min has seen a lot of damage done in the last day and a half by way of a leading negative divergence.
DIA 60 min the long term 60 min chart is leading negative and as price is near new highs for the last several months, 3C on this VERY important timeframe is near new lows, a VERY strong negative divergence effecting trends that can last weeks and even months.
QQQ
QQQ 2 min shows the negative opening gap-a perfect fade and in line status now.
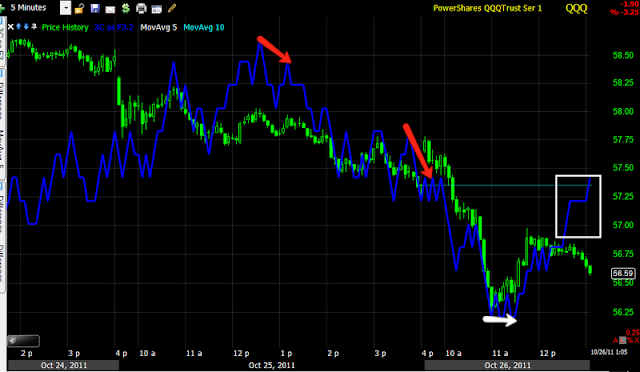
QQQ 5 min chart shows the same on the open and a slight leading positive divergence intraday, the QQQ has taken the worst hit today so profit taking and consolidation aren't surprising.
QQQ 10 min shows several days of problems and is in line now.
QQQ 15 min chart has been in line on the way down, there was a slight positive divergence yesterday at the close, which played out in an opening gap up that was distributed almost immediately, currently in line.
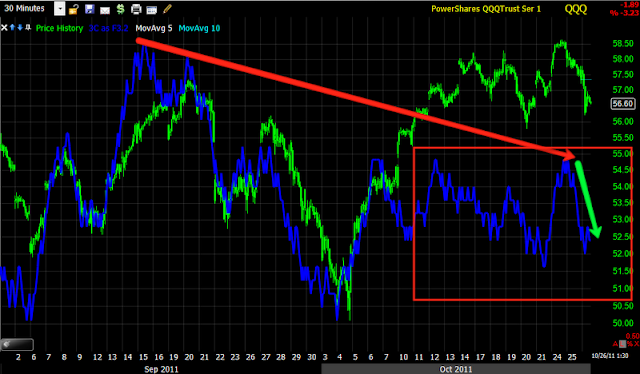
QQQ 30 min chart shows long term trouble.
QQQ 60 min also showing the major trend as being in long term trouble.
SPY
SPY 1 min a negative opening gap this a.m. and a negative divergence on the intraday bounce.
SPY 5 min-several days of trouble, another negative divergence on today's open and the same 11 a.m positive divergence.
SPY 10 min also showing a few days of distribution as we made new highs, not surprising, this is how Wall Street operates, currently leading negative, short term in line.
SPY 15 min This chart shows clearly distribution in to price highs, as I always tell you, Institutional money needs demand to sell short/distribute and new highs create that demand as Bulls chase break outs, Wall Street is able to go under the radar selling short simply by taking the other side of the Bulls' trade and no one notices anything. Again, currently leading negative.
SPY 30 min this is another fantastic example of my comments above. This is a visual map of Institutional distribution and short selling. There's a lot more to price then just price if you know what to look for. A rally is not always as bullish as it first appears.

SPY 60 min And we have long term and short term leading negative divergences.


No comments:
Post a Comment