Here are the updates USO/SCO (inverse ETF or short on crude).
USO 1 min isn't responding well this morning on the short term end, it has actually started leading negative.
The longer intraday trend on a 2 min chart remains clearly negative.
As does the 5 min chart.
The important 15 min chart remains very negative looking and surprisingly so. Does someone know something we don't? I'm sure that's the case, but this would have to be something pretty decisive.

And finally the hourly remains negative.
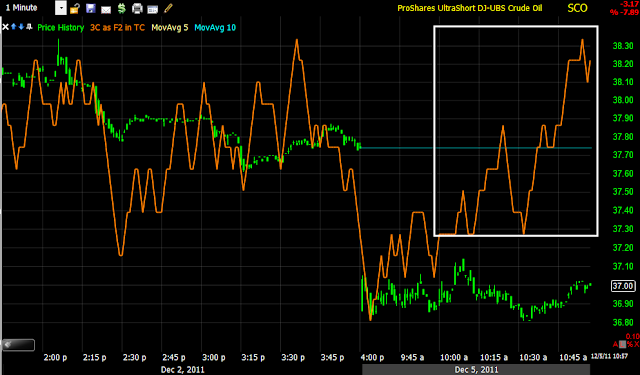
As for SCO (you buy this leveraged Inverse ETF long and have short (leveraged) exposure to crude; this should look the exact opposite of USO for confirmation.
And the 1 min chart does look the exact opposite, leading positive and very strong.
The longer intraday trend on the 2 min is also positive.
As is the 5 min, so it seems SCO is confirming the weakness in underlying trade in USO.
And the long term 30 min SCO chart.
I maintain a position in the model portfolio in SCO short crude, although my natural instinct would be not to be exposed there because of the volatility in Iran, however the underlying trade seems to be saying something different. I will hold this position until something technically changes, maybe a new closing high or certainly deterioration in the 3C charts, but for now, I'll be holding as I am surprised by the nature of the underlying 3C charts.


No comments:
Post a Comment