OK, I can't possibly get everything out to you in the form I'd like to so book mark this post because this is going to be a quick, but meaningful way to look at trade ideas, discover entries, set stops and more. We'll look at BRCM which I consider a trade right now.

Here's the daily chart and this is a way to enter a trade without too much risk, which means you can still keep your portfolio risk (not accounting for gaps as we can not protect against those except as I've outlined in the risk management post-by not committing more then 10-15% capital to any one trade). Remember, first we want something that looks toppy and if it's broken down, even better-BRCM fits the bill. This is a Swing Entry, like I mentioned in the examples I showed last night and many other times, we want to look for the upside bounce/correction and that becomes our signal candle. I've put the stop a little higher then normal to account for today's gap up which has fallen and given up all the gains-VERY BEARISH and it's called a "Dark Cloud cover" in Japanese candlestick vernacular when it retraces about half of the previous day. Today it retraced the entire previous day and then some, that's even more bearish and is called a Bearish Engulfing candle because it engulfed the entire previous day's body. Yesterday is still our signal candle (actually Friday) because it made the highest high/highest low-that's what we want to look for for this swing set up.
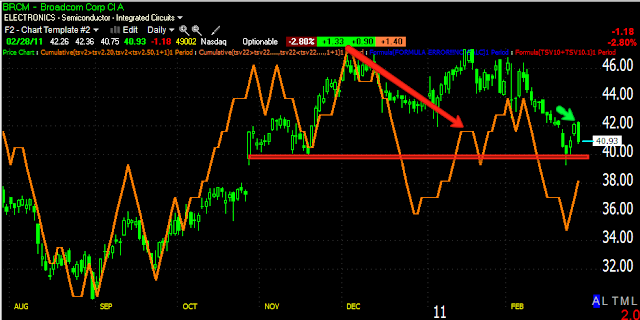
For those of you using Telechart or Stockfinder, 3C is helpful in determining whether the gap up is real or not and the top pattern. This daily chart shows us that the highs of BRCM were distributed and shorted into. We know it's a bad chart or a short, we just need a good risk:reward entry. Note the bounce off of support (red trendline) and at the green arrow we have our signal candle. Today was not a signal candle because it didn't make a higher low, despite having made a higher high.
On the 5 min 3C chart we can see the negative divergence in BRCM on the gap up in the red box, 3C moved down instead of up (which would have confirmed the gap up as bullish-didn't happen). We also have a leading negative divergence as 3C makes new lows, yet price has not yet.

Here the trend channel is set to 2 days, which held the entire uptrend, (for those not using TeleChart, a 22 day moving average is a pretty good substitute. The red trendline shows the highest high the Trend channel made before we got a close below that level at the red arrow. Now we have determined that the uptrend is over. that doesn't mean automatic reversal, we can go lateral and build a top like here, but it means the 80% gains in the middle we want, the least risky, is over and we are now at the 10 or 20% in the top that are very risky. I would have exited the long at the red arrow-the lateral movement is market risk and opportunity cost. Now the TC has turned down and we are in a downtrend so the lowest point of the upper channel line becomes our stop on a CLOSING BASIS-not intraday action-CLOSES ONLY.
The yellow ADX indicator also turned down from nearly 40 showing that the uptrend ended and now it's moving up showing the down trend is gaining strength. ADX by itself is neither bullish or bearish, it just looks at the strength of the trend and when it turns down from 40, the trend is ending in most cases.
So now we have a swing stop based on the charts above and a longer trending stop based on the trend channel-depending on your risk tolerance and other personal preferences. Because BRCM has moved below the low of the signal candle, it has set off a swing trade short.
I know that's a lot and not covered very well, but a lot is happening and I want you to have a rudimentary understanding and a way to enter trades, determine stops (and risk), be able to figure out how many shares you should purchase based on risk management by identifying your stop.
Questions on this should be emailed to me after market. There's also a video called "Swing Trade entry" that is linked on the site at the upper top right with the risk management article. Take a look. Now you have a decent way to get into trades and set up risk management. Remember that the 22 day m.a. is a good substitute for my trend channel, but also remember it must fit the stock and that's why I use a 2-day chart because that is what has worked with BRCM's typical volatility-every stock is different.


No comments:
Post a Comment