The SEC MUST address High Frequency Trading, it causes excessive volatility, it puts the little guy at a disadvantage and if left unchecked, will ultimately result in a few machines trading the market via all kinds of manipulation and have nothing at all to do with the reason the stock market was created.
When the NASDAQ alert went out 24 minutes before the close, one channel handling tickers "S"-"Z" was only about 7% away from a reset, I'd love to know how close we came on a closing basis, and thus you can see how short term manipulation can move markets. What their intention was, is still an unknown, I can think of at least 3 possibilities off the top of my head, from essentially front running trades of sort, to forcing prices down lower to buy, to just forcing prices down lower.
What was an outwardly ugly market today, did show something unique and interesting, a type of inside day consolidation. Take a look.
This is the potential Inverse Head and Shoulders bottom I mentioned earlier today.
Note that all of today's trade, every second was a sort of inside day, contained within the last hour or trade from Tuesday as you can see in the red box; an inside day-type consolidation.
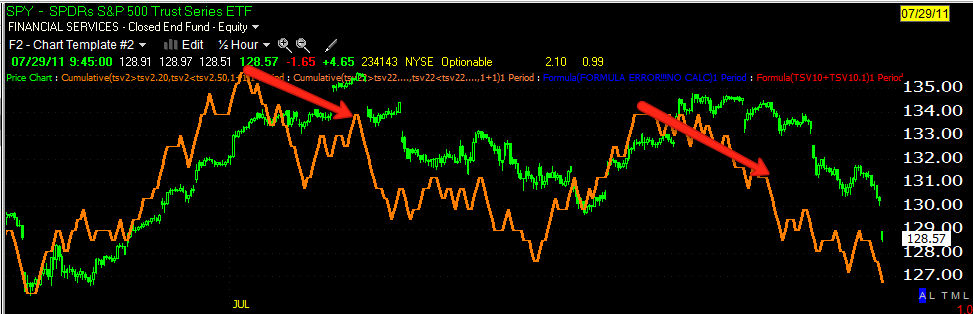
This is the reversal that got the ball rolling to the downside, this was a pretty clean reversal, but still took 3 days, rarely do we see "V" shaped reversals, especially in this market. One of our members turned $2k in to $22k on the 3C signal for this negative divergence.
The second divergence is the one above, the former one was also about 4-days.
The Price Volume Relationship today was DOMINANT-Price Down/Volume Down, of the 4 possible relationships, this one is the most ambiguous, and the most common P/V relationship seen throughout bear markets as volume tends to be low. It can also be interpreted positively as it shows there was selling, but not aggressive panic selling. You may wonder why we see a Volume Down Dominant relationship with the Quote Stuffing, it's because they are quotes that are cancelled, they never were meant to be filled, vs trades that were filled.
Interestingly, CSCO's after hours earnings release beat, but not by a huge margin, actually an uneventful margin, however the stock is up nearly 7.5% in after hours trade and as high as 11%.
CSCO's close, vs. the after hours bid/ask (light blue hash marks)
And on an intraday basis...
Here are some of the charts I watch in my nightly analysis.
This is a price volatility indicator I've been fooling with for awhile, the green hash marks are price above the volatility stop, the red are below the volatility stop. Note the IWM showing green the last 2 days. Also my Trend Channel has gone from down to flat with what would be a short cover signal coming in yesterday. This is an interesting indicator and I think will show some promise.
I'm not a huge Fibonacci fan, but it was interesting to note the 2-day chart posted a Doj candlestick reversal right at the 50% retracement from the 2007 high to the 2009 low with capitulation type volume.
As mentioned earlier today, the hourly SPY Bollinger Bands are pinching, indicating a highly directional move soon.
I have fooled round a bit with Demark indicators and created a few custom Demark indicators so I didn't have to follow the count. This is a 3 day chart, with some interesting buy signals, including recently.
Here's the 2-day version of the same indicator. There have been numerous intraday signals as well.
I'm going to eat and get back to looking through the market and specifically at breadth indicators. This is a pivotal area and right now I want to find as many pieces to the puzzle as I can. Check back later for another update.


No comments:
Post a Comment