As you know I just closed the model portfolio puts in AMZN for a very nice gain, I was a bit on the fence about it, but truth be known, for the bull trap move I think we are seeing (and which has been the basis of the trade idea before it even started), I'd prefer a longer expiration, May at least.
While this pertains to AMZN, this is also a market wide commentary. Expect the market to become more and more volatile until it actually makes that huge crack and even then, there will be plenty of days that cause you doubt. Smart Money DOESN'T want anyone to think they have market direction figured out and will use increasing volatility just as I showed you last night, to keep everyone guessing. However, we have looked at many pieces of the puzzle and they are all telling the same story.
I'll use AMZN's late 2012 30% sell-off as an example...

From left to right (when looking at historical charts, try to put yourself in the emotional position you may have felt then and remember each day you look at, you have to look at as if you don't know what will happen the next-retrospect is easy, but we live at the right side of the chart-so that's your challenge), the move up in the red box saw a confirmed reversal and a sharp gap down, you might be inclined to think more downside was coming, then 2 days of rally essentially filling the gap and a bearish engulfing candle. You may have thought, "The gap is filled, we have a bearish engulfing candle, time to short" then another day up and intraday it was strong followed by a quick move down. In October AMZN rallied to a new high, so what looked like a breakdown hit a new high, this is the head fake move we almost always see before a reversal. Even then in the second red box, trade was choppy and volatile. After the first big candle down, we saw several days up, then the real crash. After that crash, you might expect AMZN to keep crashing, but it rallied at the first green arrow, long term it never put the downtrend at risk, but the daily candles would have driven you nuts with the ups and down every other day (in the yellow box). As the trend moved away from the top volatility died down.

This is the confirmation of the head fake move in AMZN, however we have the gap open, I'm hoping I can time this well enough to get a decent position as AMZN could snow ball from here.
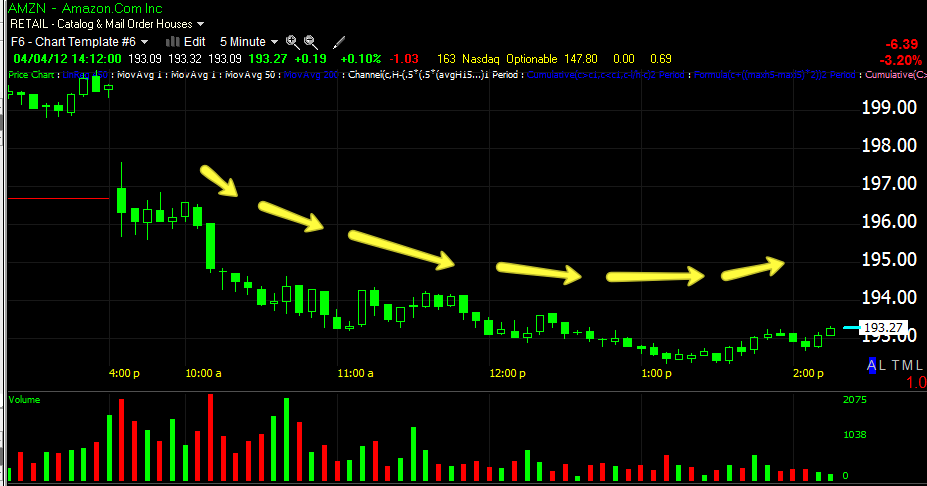
Intraday, a rounding bottom and rounding volume, suggests a move higher to fill the gap.
The 3C 2 min chart intraday and the gap area.
The longer term 3C chart makes the AMZN decline look simple, but look at prices, they bounced around a lot and filled gaps before moving lower.
The long term 60 min chart seeing damage from this recent move, which I think is a head fake move, but there's always the chance when important support is broken, that we see a shakeout.
The daily Money Stream chart confirmed AMZN's rally at the green arrow, it went negative last year and is leading negative, so all in all, AMZN looks set for a bigger move down, it's just a matter of getting that high probability / low risk position.


No comments:
Post a Comment