My earlier post this morning showing how head fakes play out and specifically the current market was an attempt to anchor expectations, while I think we are through the worst of the false moves (The Crazy Ivan shakeout is one we haven't seen in a while, but made perfect sense as it fed the bears everything a Technical Analysis textbook tells them to look for), this morning's post about head fakes did mention a couple of areas where some volatility is likely. First the apex of the bear flag (which was actually a bear pennant) as that is a resistance zone and bears who are overwhelmingly bearish will expect a failed test of that area, that would bring their confidence level up, get them shorting more and that's what a bear trap is all about. The bigger area is the resistance area of the SPX top, that's where a short squeeze will do some real damage so I also mentioned that area. While things have gone according to plan (everything we were looking for has happened-maybe not on out schedule, but we don't have a crystal ball) and trade should get a lot easier than it has been, don't expect Wall Street to make this easy for bears or bulls, it's a zero sum game and for them to make money they have to take it from others. Just be realistic about the market, keep your eye on the big picture and use Wall Street's games to your advantage. It wasn't emotionally easy for many of you to short the highs of March-May 1, but it was low risk and profitable, it wasn't easy to buy speculative longs in to a falling market, but we weren't buying to be contrarian, we had hard evidence. Usually the hardest things to do emotionally are the least risky, just keep that in mind (this is also why I think every trade journal should not only have the trades, the market conditions, the reasons why, but most importantly, as much honest information about your emotional frame of mind-that's where you'll make the discoveries that improve your trading.
OK, enough of the rant, on to the charts...
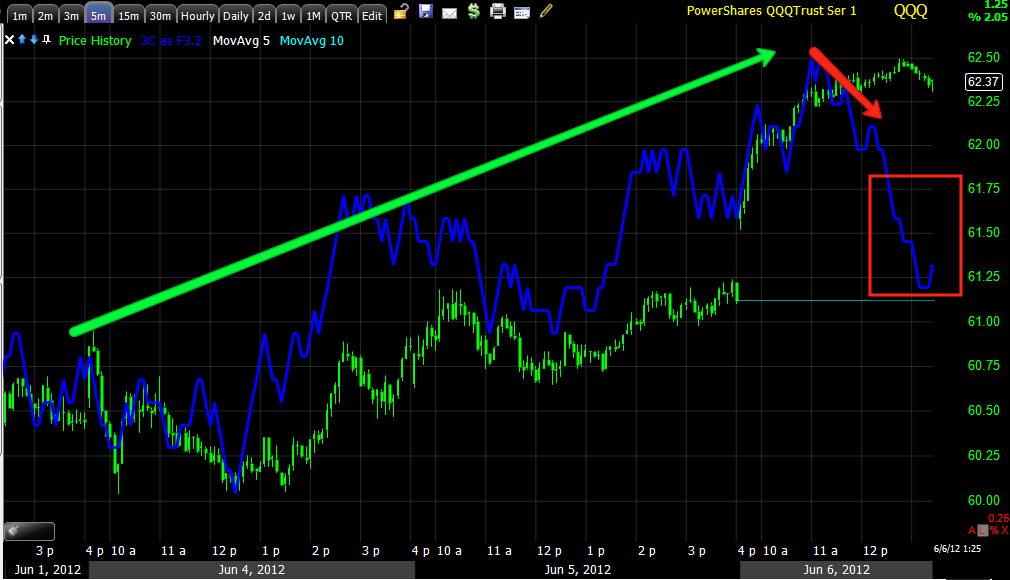
QQQ 5 min confirmation and a negative divergence today with a leading component to it, still not very big in the larger picture, but enough to consolidate or pullback and this is the area bears are looking for that to happen. For newer members you can email me for the link to a weekend post that shows the big picture and how bearish this market really is, but nothing goes straight up or down and bear market rallies are some of the strongest rallies you'll see.
QQQ at the bear pennant apex and what would be considered a breakout above the apex which would have bears nervous about a failed bearish patten days after they shorted the market on the break below the apex. This is a line in the sand, momentum today clearly shows that.
Being the Q's are Tech heavy and being I've expected Tech to lead the last bounce, here's tech on a 30 min chart, the pennant portion of the bear flag started around May 18th -31st, note the leading positive divergences and several very large relative positive divergences like the one at the recent lows, now the chart is leading positive almost to a new high and the sharpest leading positive divergence on the chart.
Tech 5 min with the distribution at the May 1 top, confirmation on the way down and an overall leading positive divergence through the formation of the pennant and the break below it, note the leading positive is higher than anything on the chart incl. where 3C was at the May 1 highs.
Tech 2 min intraday, confirmation lost momentum and went negative then slightly leading negative, remember though this is a short term intraday chart and this is the area I was talking abou in my 2nd post of the day.
The SPY at resistance of the bear pennant (yellow box), you can click on the chart for an expanded view.

SPY-Here's the 15 min chart I should have shown earlier instead of the 5 min, note from left to right the May 1 negative divergence (what keeps stroking me is the size of that negative divergence and all the downside from it compared to the size of the current positive). As I showed you last week and several other times, we have seen in almost every average, industry group and a slew of stocks a positive divergence starting May 7th-15th-ish. I might have been temped to call it a failed divergence (although they are rare), if I hadn't seen the CHK chart that did the exact same thing, but w/ CHK, we had the actual dates & amounts Carl Icahn accumulated so we were able to verify that 3C was correct, so I learned something new about the accumulation process. Being this divergence is everywhere, I don't think it is coincidental. The bear pennant is in leading positive position throughout (marked by the white trendline just above dates). The 29th is the upside failed breakout that was important as a failed test for sucking in bears, now the leading positive is well above the May 3C level and price highs.

SPY 5 min, that's a fairly small negative divergence (relative divergence).
SPY 3 min showing resistance at the yellow box and a negativ divergence intraday as prices reach that area.
Financials 15 min-negative at the May 1 top, that same accumulation/positive divergence from the 7th on, Financials going very positive at the drop and now setting a new leading positive divergence.
Financials 3 min intraday, a negative divergence today.
Really there's not much here that is surprising, I think everything is still on track.


 | Theme by Thur
No comments:
Post a Comment