-High Yield Credit closed at the lows of the day, but held up slightly better than the SPX on the day.
-High Yield Junk Credit only lost about half of the SPX on the day, it traded much like the SPX intraday.

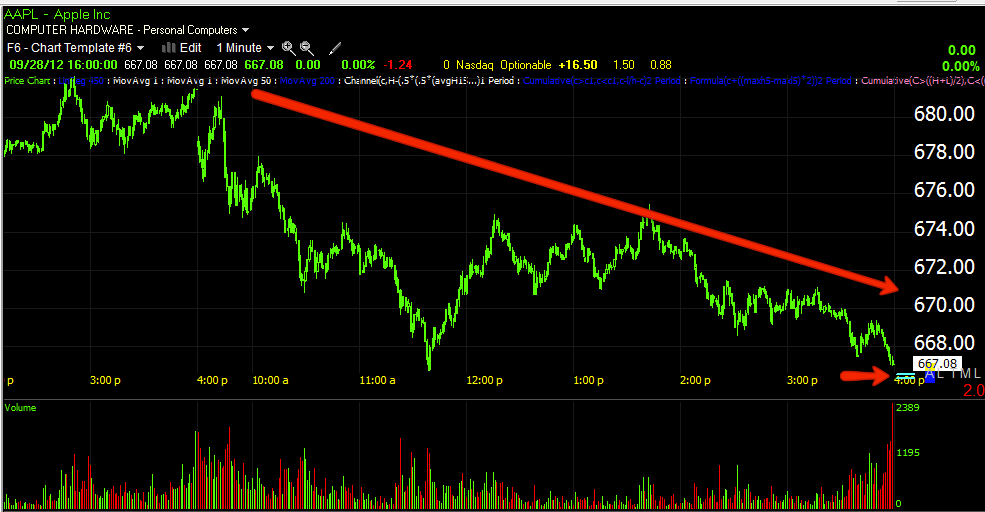
I often point out the reversal candlestick on volume concept that works so well on virtually any timeframe. At the green arrow we have a "Hammer" bullish reversal candlestick on increased volume, the next day a reversal (remember I always point out that there's no way to judge how long the reversal will last, it's just a reversal of at least a day). At the red arrow today we have a bearish "Shooting Star" candlestick on rising volume. To remember these candlesticks and their meaning, the hammer looks like hammer and should be found after a trend down, "The market is hammering out a bottom". The "Shooting star" should come after move up and as the Japanese say, 'A shooting star portends trouble overhead". Finally the body of the Shooting star is within yesterday's body which also makes it a bearish reversal "Harami" or what we call in the west, "an inside day", the Japanese call it, "Mother with child".
As for the EUR/USD...


Overall since the announcement of QE3, the Euro remains closely correlated with the SPX.
Yields which have been an excellent leading indicator topped out today about 30 mins. before the SPX topped out. Yields have also been closely correlated with the SPX since QE3, but they are significantly dislocated between August 16 and Sept. 14 (a month) with 5 year yields down -12.4% vs the SPX up +3.55%, this traditionally has been a strong reversal signal for the market.
Of the 3 most important industry groups, Tech, Energy and Financials, Tech had the worst week since last Friday, down -2.22% vs the SPX at -1.35%. AAPL closed near the lows of the day, and lost more in After-hours in the $666 area.
The defensive Utilities group was the only of the 10 major industry groups to close green on the week at +1%, you'd hardly believe QE3 was announced the way the market is trading.
Transports continue to suffer and diverge from the market, IYT closed within $0.15 of making a new closing low for the year.
We've heard from the world' largest shipper this week, Maersk and the news wasn't good as mentioned yesterday. The Baltic Dry Index, a daily index of the cost to ship dry goods is near 3 year lows.

The US Dollar index gained +0.75% on the week, with oil seeing a -0.90% decline as the two have an inverse relationship,the PM's, gold and silver actually closed the week just about unchanged, but there still appears to be some trouble coming for GLD.

It's a very strange market, it doesn't trade at all like QE3 had just been announced. I thought after the QE3 announcement one theme we might see is lower prices so institutional money can accumulate , preparing for a QE ramp, but we just haven't seen that anywhere consistently.
I'll be adding any new information I dig up over the weekend, in the meantime, enjoy your weekend!


No comments:
Post a Comment