I'm going to add a speculative position of about 5% to the equity model portfolio long holding for AMD. This way there's no pressure, no expiration dates and if this wants to become something bigger, there's nothing stopping me from letting it become what it wants. There's also plenty of room to add if that looks like something I might want to do.
AMD lost ground from the 19th' late day run, but held up well on a relative basis vs the market on the 20th. You may recall FB had an initial first run in August and some of you made money with leverage, but from the first sign of that initial small run in FB, it seemed very likely FB would go on to build a larger base, that appears to be what's happening in AMD, although I'm not very confident that the base will be anywhere near as large a what developed in FB.
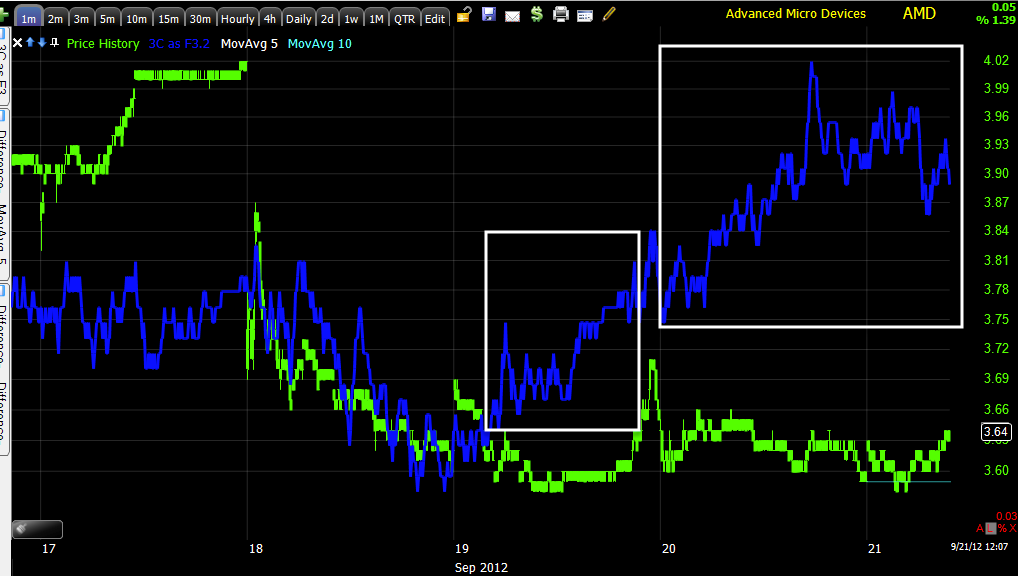
The 1 min chart looked very strong on the 19th, it has only added much more in a leading positive trend in the tell-tale flat price area.
The 2 min chart shows what looks to be apparent accumulation at the white trend line.
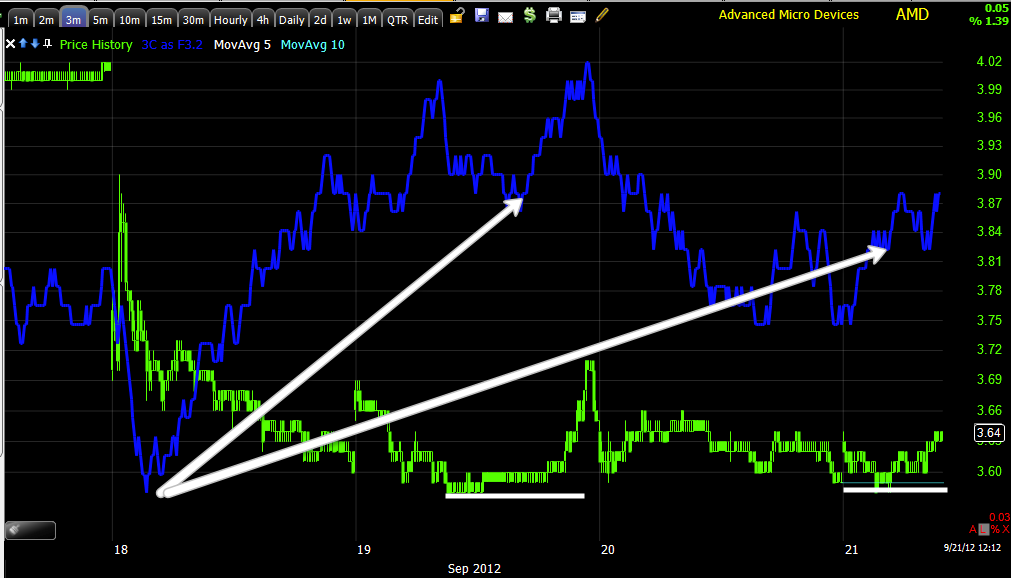
The 3 min chart is also leading positive (thus far good migration through the timeframes) and again the support area at $3.58 seems key so far. If the support zone goes on for too long and becomes too obvious, a shakeout below it becomes increasingly likely.
The 15 min chat has developed quite quickly as it fell apart quickly as well, but a nice leading positive there as well.
Now even the 30 min chart is picking up on the action in the timeframes that are below.
I'm not going to post it now, but there is a chance that there might be something even larger developing on the 4 hour chart, again right now I can't say that it has caught up and is relevant, but I'll be keeping an eye on it.


 | Theme by Thur
No comments:
Post a Comment