Wednesday, October 31, 2012

Still Like ZNGA for at least a speculative long

ZNGA is another stock that has had plenty of gaps down on big volume providing the two things needed to accumulate, supply and cheap prices and that's exactly what looks like has been going on in ZNGA.

 ZNGA change in trend

 Gaps down on volume, traders are too predictable where they will place orders/stops.

 4 hour chart from a leading negative to confirmation of the downtrend to a leading positive divergence.

 15 min chart shows positive divergences at the gap down areas


 10 mi chart does the same, and even shows small distribution to turn ZNGA back down in to the accumulation zone.

 The same on the 5 min chart with a recent gap and stop level hit with positive divergences.

 3 min chart leading positive


Same with the 2 min chart.

I featured ZNGA last week, but I'll likely be looking for an area to open a long position tomorrow.

NFLX Postmortem

NFLX was a long trade idea mentioned several times in July, but specifically an idea in which we wait for NFLX to pullback and come to us at a better price was put out on July 23rd in this post.

I wasn't expecting the pullback that we saw, but there were a few members who followed upon the trade and did trade NFLX long and made some money.

It was released today that Carl Icahn bought 10% of NFLX and the stock was up +13.77% on the day, the catch with 3C analysis, of all of the shares Icahn bought, only 500k were actual shares, the rest were bought via Call options (Sept 4, 2014), about 5.541 mn call options.

I doubt 3C would be showing much as far as the call options or the 500k in real shares bought, but I would think someone or quite a few someones on the hedge fund side of things caught wind or noticed the unusual options activity (5.5 mn of Sept 2014 calls!?!?!).

In that case, I suspect some hedgies piggy-backed Icahn's trade.

Any way, what we were looking for back in late July was a move down, we got a much bigger move down than we expected.

 Here's NFLX in green and the SPY in red, around late July NFLX did drop while the SPY was headed higher on bad earnings, it turns out we might have been able to see a leak in the earnings back then, the second earnings miss in yellow looks less likely we would have found anything.

In the July trade idea, I mentioned what looked like a base building in NFLX, now according to filings, Icahn didn't start buying up calls until early September, I can't explain all of this, but we rarely can when we see money moving, we don't know why, we just can see it moving.

 This 2 hour chart shows a clear change in character in NFLX from a  confirmed downtrend to positive divergences sending NFLX higher and sideways.

 On the hourly chart in June there was a positive divergence, someone I think knew earnings weren't going to be good and sent the price higher to sell in to higher prices. Note the positive divergence sending prices higher.

Here's the hourly chart just before earnings and the gap down, it's in a leading negative divergence.

Even from the post in July, there were signs of a negative divergence or selling...

From the actual post with the actual commentary...
" The 1 min trend finally signaled NFLX was ready to move down from this plateau it has been trading on."

"The divergence on the 30 min chart is quite clear, not much noise so this tells us the path of highest probabilities is down, but not in a destructive way, rather a constructive way, this is why we'll be watching for signs of accumulation on a pullback."

And the general trade idea...

"If something like that happens, NFLX would be likely to fill this gap in yellow, so for now I'd consider this noise, but keep watching for that move lower in to underlying strength. With the size of the potential base, it should be able to sustain an impressive move up and the entry would be at much lower risk and higher probabilities."

As you can see, NFLX did fall on earnings and did build a larger base on a positive divergence, somewhere during all this Carl Icahn bought 10% of the company.

It just goes to show, you never can really understand what is going on until the reasons are no longer profitable, but when we see big changes and movement in money, usually something is going on.


Currencies

For the most part, the Euro' ETF FXE and the $USD UUP look pretty good for a move up in the a.m.

AAPL Update

There are so many things to look at in the last hour of trading it's unreal, but we can't miss AAPL which added to some impressive timeframes today.

 As for daily closing candles, Friday's Hammer on volume was a nice reversal candle, today's doji star also fits well with Friday's candle for a candlestick reversal.


 AAPL added to leading divergences today alone such as on a 10 min chart

 A 15 min chart which is more impressive.

 And a 30 min chart, even more so.

 Intraday the 2 min chart is pretty much in line, it doesn't look like there's any strong bias toward the open tomorrow.

The same is true of the 3 min which is positive, but intraday also in line with the trend.

Ultimately AAPL looks better than you'd think by looking at price only, how the last day of the month effects the flows, I don't know as the T+3 rule is still in effect for funds.

MCP Charts


 MCP is coming out of a bullish descending wedge, rather than breaking out to the upside, these almost always create a lateral base, unlike what Technical traders expect. The volume in MCP is also interesting, that's what first turned us on to UNG.

 There are several high volume support areas taken out that provided plenty of supply at cheap prices, an ideal place to accumulate MCP and thus far the price pattern looks exactly like that.

I can't say this is it for the base, but I do think MCP will see some upside from this area, it may come back down and keep building a base, it that's the case, the position added would be sold on any negative divergence suggesting a move back toward base-levels.


 MCP 15 min shows large positive divergences in the areas in which support was broke on heavy volume, perfect as it produces supply, cheap prices and cover as someone has to take the other side of the trade, no one suspects accumulation

 MCP 2 min recently with a trend that has a leading positive divergence.

 Close up of today's intraday 2 min leading positive divergence

 That migrated to the 3 min chart with a leading positive divergence

 And on to the 5 min chart, also leading positive

The 10 min trend also in a leading positive position.

For me, even though there's no strong head fake move to the downside, this si still worth adding to bring the position up from speculative (50% of normal) to 2/3rds and heading to a full size position.

ADDING TO LONG MCP

There was already a 50% normal size long position in MCP because of the base-like formation, I see something I like here, although not quite the head fake moveI'd like to see, I would be willing to bring MCP up to 2/3rd normal size position, perhaps this additional position becomes a trading lot that is used to trade around if it looks like a better price may come after a pop, or perhaps it will stay, but I like what I see as it has pulled back.

Charts coming.

Full Market Update

Since the early "Opening Indications" post today, in which we expected some market softness, but still saw the probabilities of positive divergences and positive market activity to follow, I've been very pleased with the way today has gone.

I'll just remind you, the bigger the base, the bigger the move it can support.

We have seen excellent migration through timeframes today, the range we were looking for developed very well. I have very high hopes for this move and taking advantage of it.

This is today's NYSE intraday TICK chart (Number of advancing issues less declining issues), the point is we are not seeing any extremes on the downside, as for the upside we have a nice trend building here which is also not extreme, but we are still within a range, no one is covering in a range or buying or selling short so the actual TICK values are fine with me, I'm just happy not to see extreme downside TICK readings.

As for the averages...

If I wasn't already set with my leveraged long positions in different areas such as small caps, Financials, Energy, Tech, etc, I'd be actively pursuing speculative sized positions in enough of these leveraged long ETF's to have decent coverage for the recent rotation we have seen.

 Dow's range, before it started I said it would be difficult to see until it was in place and too late to take advantage of, here it is clear to see. Often head fake moves above the range or below the range lead to moves quickly to the other side of the range. As far as the way the ranges were drawn last week, Friday was like a head fake move under those ranges, which is one of the last things we see before a reversal, another thing we see is the short term divergences migrate through the timeframes and are strong.

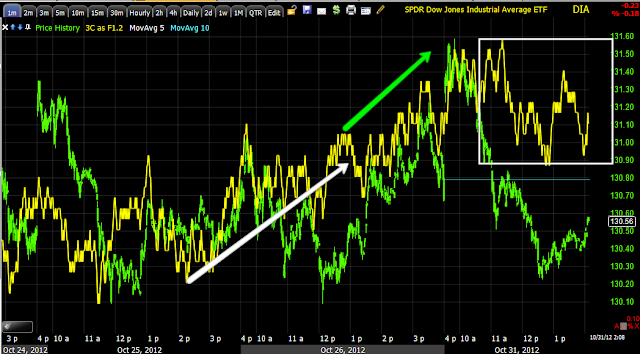
 DIA 1 min leading positive today

 DIA 2 min leading positive

 DIA 3 min with a negative divergence on the gap up this morning and a very strong leading positive divergence since.

 A beautiful 5 min leading divergence formed in the last 2 hours!

 Overall, the DIA has a nice 60 min leading positive divergence, although in shorter timeframes we can see the negative divergence at the peak in mid-October, we can't see it on an hourly chart because it wasn't strong enough to show up here, that means this positive is impressive.

 IWM range

 IWM 1 min leading positive

IWM 2 min leading positive

 IWM 3 min relative positive and leading positive


 IWM 10 min positive divergence at the range.

 IWM 30 min leading positive at the range, again the negative divergence at the last peak can't be seen as it was not strong enough to make it to this chart, making this positive divergence even more impressive.

 QQQ Range

 QQQ 2 min relative, then leading positive divergence.

 3 min leading positive divergence today

 Beautiful QQQ 5 min leading positive divergence at a new local high

 QQQ 30 min leading positive divergence and some large relative positive divergences as well.

 SPY Range

 SPY 1 min leading positive today

 SPY 2 min leading positive

 SPY 3 min leading positive

SPY 15 min leading positive, much put in today.

SPY 30 min large relative and leading positive.

I love the looks of these charts.