I'll just remind you, the bigger the base, the bigger the move it can support.
We have seen excellent migration through timeframes today, the range we were looking for developed very well. I have very high hopes for this move and taking advantage of it.
This is today's NYSE intraday TICK chart (Number of advancing issues less declining issues), the point is we are not seeing any extremes on the downside, as for the upside we have a nice trend building here which is also not extreme, but we are still within a range, no one is covering in a range or buying or selling short so the actual TICK values are fine with me, I'm just happy not to see extreme downside TICK readings.
As for the averages...
If I wasn't already set with my leveraged long positions in different areas such as small caps, Financials, Energy, Tech, etc, I'd be actively pursuing speculative sized positions in enough of these leveraged long ETF's to have decent coverage for the recent rotation we have seen.
Dow's range, before it started I said it would be difficult to see until it was in place and too late to take advantage of, here it is clear to see. Often head fake moves above the range or below the range lead to moves quickly to the other side of the range. As far as the way the ranges were drawn last week, Friday was like a head fake move under those ranges, which is one of the last things we see before a reversal, another thing we see is the short term divergences migrate through the timeframes and are strong.
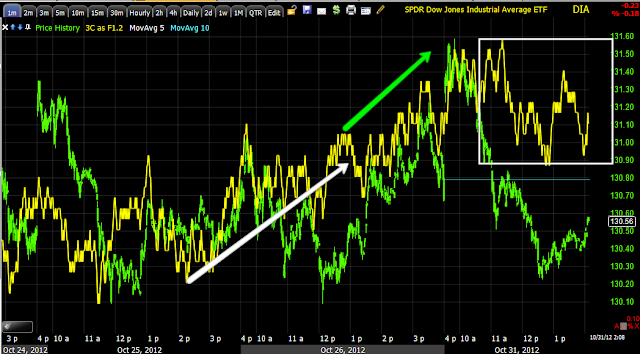
DIA 1 min leading positive today
DIA 2 min leading positive
DIA 3 min with a negative divergence on the gap up this morning and a very strong leading positive divergence since.
A beautiful 5 min leading divergence formed in the last 2 hours!
Overall, the DIA has a nice 60 min leading positive divergence, although in shorter timeframes we can see the negative divergence at the peak in mid-October, we can't see it on an hourly chart because it wasn't strong enough to show up here, that means this positive is impressive.
IWM range
IWM 1 min leading positive
IWM 2 min leading positive
IWM 3 min relative positive and leading positive

IWM 10 min positive divergence at the range.
IWM 30 min leading positive at the range, again the negative divergence at the last peak can't be seen as it was not strong enough to make it to this chart, making this positive divergence even more impressive.
QQQ Range
QQQ 2 min relative, then leading positive divergence.
3 min leading positive divergence today
Beautiful QQQ 5 min leading positive divergence at a new local high
QQQ 30 min leading positive divergence and some large relative positive divergences as well.
SPY Range
SPY 1 min leading positive today
SPY 2 min leading positive
SPY 3 min leading positive
SPY 15 min leading positive, much put in today.
SPY 30 min large relative and leading positive.
I love the looks of these charts.


No comments:
Post a Comment