Tuesday, February 5, 2013

Bringing AMD to Speculative Long

AMD is a position we were long for a decent profit of 27%, we closed it out as a pullback looked likely, I maintained a small tracking position to keep it in mind that is up 10% and at this time I see AMD as worthy of at least a speculative size position, leaving room in your risk management to bring it up to a full size position.

Here's what happened and what I see now.

Many of you will probably remember the events in AMD being a low priced stock, each of these moves were pretty significant and for those who don't recall, this is a great look at typical market behavior including when, where, why and how technical traders are used so smart money can get their way.

A) Downside Capitulation, a big move with a lot of volume as long traders essentially all throw in the towel at once; this create a great source of supply for smart money to accumulate, but the capitulation move that typically marks the end of stage 4 decline, often drifts lower in the construction of a stage 1 base.

B) Obvious, defined trading range- It's important that all 3 characteristics are met, the more intense each of the characteristics, the more effective "C" and "D" are.

C) Crazy Ivan Shakeout / Head-Fake Failed Breakout- Both occurred the same day. "Crazy Ivan" comes from the movie, "The Hunt for Red October" and is a Russian submarine tactic to stay hidden from enemies. The only place an enemy sub can follow another is right behind them in their prop-wash of what are known as the baffles, the submarine that is following masks its own noise by staying in the target sub's own noise. The Russians found a way to "Clear their baffles" and make sure they aren't followed, it's called a Crazy Ivan and is simply a 180 degree turn toward any following/oncoming submarine-forcing the other sub out of the prop wash and exposing them to acoustic listening devices, it's kind of like a game of chicken.

In trading I call a run of the stops and orders both above and below a range, a "Crazy Ivan", they essentially have cleared all the stops and orders. In doing so in this case, it also cause a breakout above the range that obviously failed, note higher volume in the area.

D) Head-Fake-False Breakdown. Because Technical traders are so predictable as is human nature, they identify a support level and think that support should hold, that's what Technical analysis teaches, so a stop just below support should be effective as far as they are concerned, it also allows them to keep tight stops and take on more shares, that's greed and the wrong tactic for a trade that is still working itself out, it needs room. However the drop below the range causes sellers and short sellers to come in to the market creating supply again, which can be accumulated on the cheap and in a very liquid market. After that accumulation period we see a break to the upside which brings us to...

E) Symmetrical Triangle-Consolidation/continuation pattern. There are 3 types of triangles in the consolidation range, 1) Ascending (right angle) triangle which is assumed to be bullish according to Technical Analysis, 2) Descending  (right angle as well) and assumed to be bearish and symmetrical which has no bias itself, the bias is determined by the preceding price trend just before the triangle forms. It is assumed that the sym. triangle will continue the preceding trend, at least by technical traders. We have an upside breakout from the apex of the triangle that leads to...

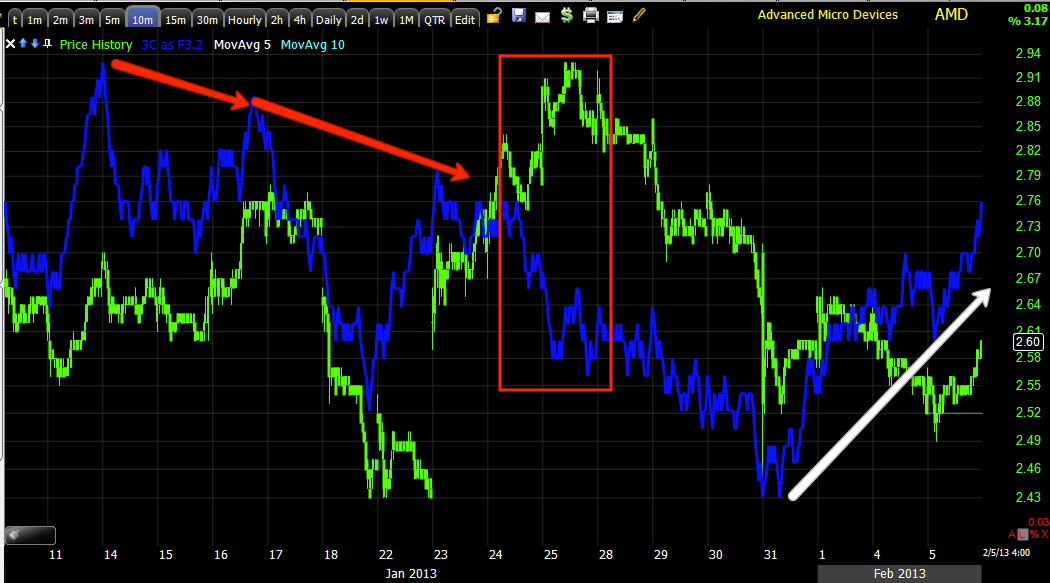
F) Another Crazy Ivan. You can tell limit orders and stops were all hit the same day just by looking at the increased volume that day, it's about 70% more than the average.

G) Head Fake breakout/ Failed Breakout. However in this case, I believe it was specifically designed as such to allow more accumulation of AMD which brings us to the 3C charts.

 This long term 4 hour chart removes the noise and reveals the strong underlying trends or flow of money, I labelled what each color means for some of our newer members: White =positive 3C divergence/accumulation, Green=3C trend & price trend confirmation, Red=3C negative divergence/distribution. Arrows=relative divergences, 3C is compared at two relative price points whether they are the same or one is higher or lower, these are typically the first divergences seen and are the weaker of the two types. Box around 3C, either red or white=Leading negative or positive divergence, this is the strongest divergence and tells us there's heavy activity, these usually appear after a relative divergence.

 We were obviously interested in AMD recently with accumulation in to price lows.

 As price moved off the lows our position was at a nice gain, however the yellow box denotes a head fake move-usually above or below a defined level traders watch, it could be support/resistance, price pattern breakouts, moving averages, new highs/lows, etc. The point is, it's a false move and we see these pop up about 80% of the time before a reversal, there's a whole study of head fakes, how we know when they are coming, how we can use them to our advantage and why they are used by Wall Street. These two articles I wrote are the first tow of a 3 part series all about head fake moves.

Part 1-"Understanding the Head-Fake Move...How Technical Analysis Went From an Asset to a Trap"

Part 2-"Understanding the Head-Fake Move...Motivation"

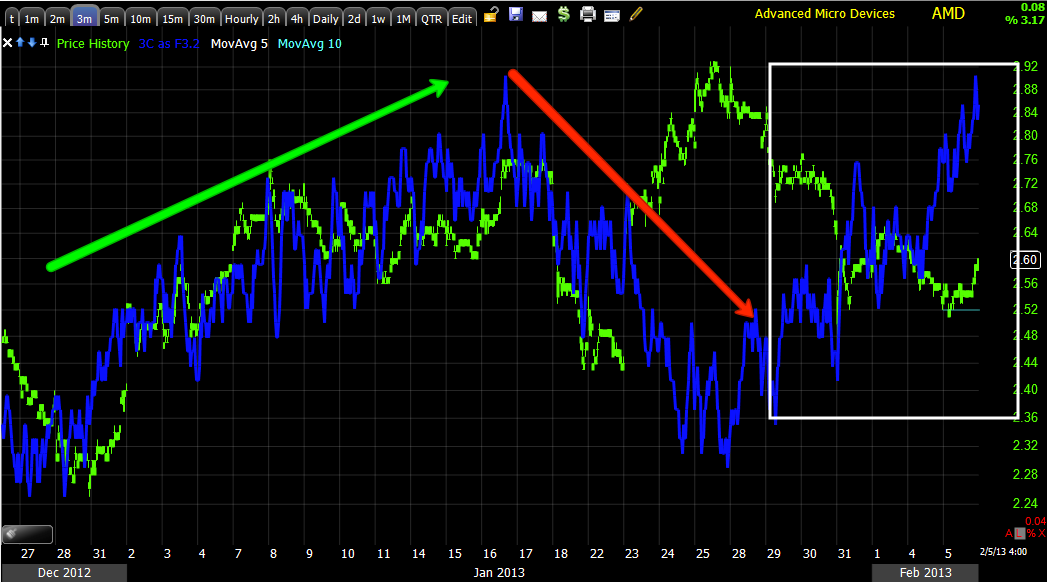
In any case, after the move we get a pullback with a positive divergence in to the pullback telling us AMD is apparently being accumulated at lower prices, which is what we want to do as well.

 This 10 min chart shows a relative divergence first as price makes a higher high and 3C not only fails to make a higher high, but in fact makes a lower high. Then at the top we see a leading negative divergence as distribution picks up in to higher prices and demand, this is the head fake and traders are trapped there at a loss. As prices move lower we have a relative positive divergence turning in to a leading positive divergence.

 The 3 min chart shows a lot more detail and it's a different level of activity, usually market makers or specialists rather than the heavier money flow of institutional traders, we have confirmation, a leading negative divergence (just drawn with an arrow) and a leading positive divergence. Essentially there was some level of accumulation almost as soon as prices moved lower.

 Using my X-Over Screen which is a trading system itself, we see a sell/short signal at the far left at the three red boxes on each indicator, this stays bearish as only the price moving averages crossover briefly, known as a whipsaw, this system is designed to eliminate getting whipsawed out of trades as the other two indicators don't agree at the orange boxes. At the white boxes we have a long/buy signal.

I actually prefer the longer 3 day trending system for a stock like AMD, but you have to have the stomach for the draw-down, the faith in the system, the patience, the risk management that allows for larger consolidations and corrections and the account that can handle the draw down without creating margin call issues as I never meet a margin cal with cash. These longer trading systems back test much better, they need a lot less of your time and they have a lot less transaction costs including slippage. The first short on the chart made 40% conservatively, the next long made another 40% on the conservative side, the short made 70% and the new long is just getting started. This is a good system for those that prefer confirmation and higher probabilities over squeezing as much out of the trade as we can or for those that can't watch the trade as often.

Others would prefer to trade around the consolidations and pullbacks and you can certainly make a bit more that way, but you have to have the time and it's better suited toward larger accounts that aren't effected by transaction costs (i.e. a $5000 account using reasonable risk management might have a $1000 position limit, if you make 5%, that's $50 and the transaction costs could be $20 if you have a $10 trade fee; however if you have a $100k account, the same 5% is $5k and the transaction costs of $20 are negligible.

In any case, AMD looks interesting as a long here, I'd prefer to phase in to it.


No comments: