I received a couple of emails since Friday based on this sentence from a post yesterday, Friday
"My "guesstimate" is that the SPX will likely hit at least > (below) SPX $1525 before the first significant correction."
I don't like giving targets unless there's something very clear, I'd rather listen to the message of the market telling us when we are near a target zone.
However there are some concepts I follow and have a strong belief in within the realm of "Market Behavior" and that is largely based on how the market knows what technical traders (retail, where they do a great deal of fleecing) are paying attention to, where they will have the strongest reactions.
If you had to guess what moving average technical traders pay the most attention to, what do you think it would be? You'd probably answer, "The 50-day/bar moving average" and I'd probably agree with you. However clearly the second most popular would be the average that is used with the 50-day that give us such important Technical Analysis setups such as "The Golden Cross" or the "Death Cross" and that is the 200-day/bar moving average.
First this work is based off some one else's initial data that I checked on and worked to find a more accurate method.
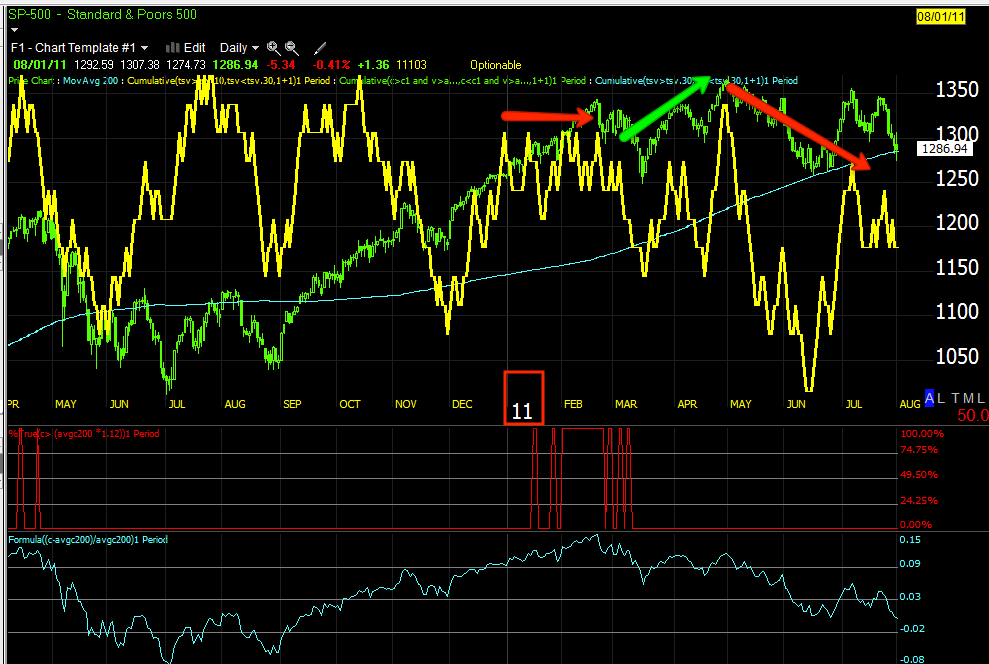
This is the original chart and comments

"Each time the S&P 500 has traded more than 12% above its 200-day moving-average, the following correction has not ended until the average itself was breached by price action"
At the green arrows we see a 12+% move in the SPX above the 200-day m.a., after that there's a move below the 200-day m.a. represented as red on the histogram, sometimes just below the 200, sometimes significantly below.
I re-created the code for this to look closer, for me it wasn't at all about a sell signal, it was about the accuracy of a timing.
I found the premise held up, especially over a number of years, but there were some areas where the timing was not useful.


After trying quite a few indicators I simply went to the daily version of 3C, this was the first 3C indicator, first used exclusively on daily charts.

The other signals are there, but they are bot as sharp on a long scaled out chart like this, so here's a closer look.


The 200 m.a. has been broken in all the examples on their first chart since 1994, I can't argue with that, so $1525 in my view is the minimum first target.
For a whole bevy of reasons I don't think we stop there, I do think we see a countertrend move or consolidation, but it could be 8 or m10% below the 200 before that happens, I'd just say from historical precedent that $<$1525 is at least the first downside target at minimum.


No comments:
Post a Comment