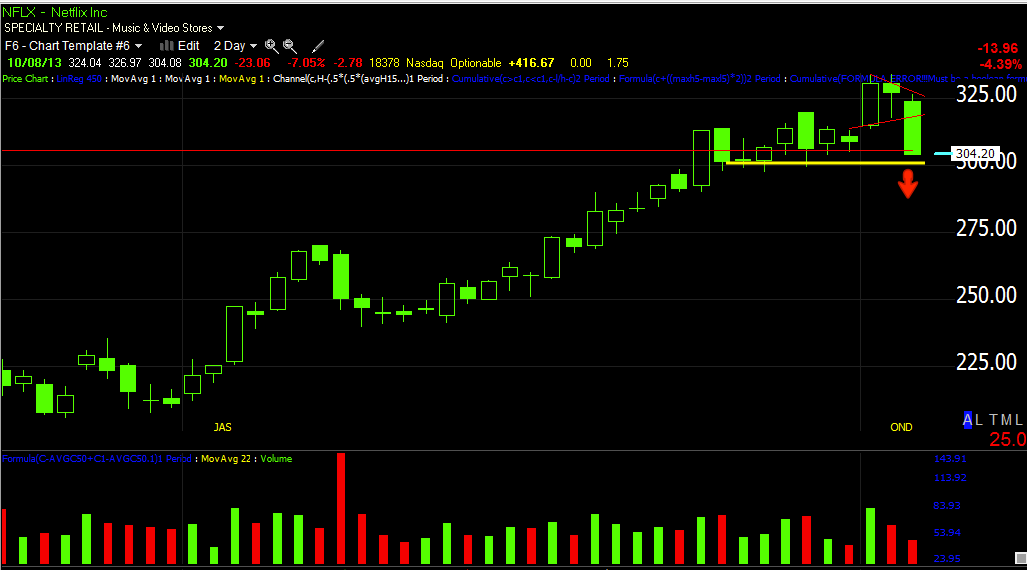
"NFLX did everything it had to do to form a great double top in the new technical analysis.Looking at NFLX, my judgement tells me there's probably a little better entry, my gut tells me, "Who cares?"

The Core Short Position in NFLX is nearly filled out, but I'd love to add a little here if I can, I just don't think the risk management parameters will allow me to add much more than maybe 10% of what's already in place.
I wouldn't want to chase NFLX here today on a 4+% move down, but I'd say generally speaking, any position or add-to ABOVE $300 is a decent area for the long haul which is what these core positions are meant for, trending trades.
Symmetrical triangles were published at least as early as 1948 in John Magee's "Technical Analysis of Stock Trends" that is now in something like its 10th edition, it's pretty much the text book of T.A. that most everything else derives from although Charles Dow did Technical Analytical work in the late 1800's that others added to.

I'd consider NFLX a short on any bounce above $300. The $318 area looks interesting, I'd also leave a little dry powder for a move above $328.50, not a lot, but some.


After I hit stops under $297, I'd take NFLX (with all the shares I accumulated on the cheap under $300) and bounce it up to at least $320, ultimately over the next few days if I could get it above $330, that's where I'd take it...Just thinking like a crook.
They'd need to distribute shares picked up on the cheap on the way up, I'd expect a large portion to be distributed right above $300 and then the rest the closer we got to the apex of the triangle. I'M SURE THE BULK OF THE INSTITUTIONAL SHORT IS IN PLACE LONG AGO, THIS WOULD JUST BE A CHANCE TO AVERAGE UP THE ENTRY PRICE A BIT.

Keep an eye on NFLX, I'm setting some price alerts and see if I can add, being there's so little room (if any) to add, I'll be looking for the best area possible which is close to the apex of the triangle.
In my view, AMZN and NFLX are two shorts at the top of my list.


No comments:
Post a Comment