AMZN has been a core short that has been phased in yo at different levels that looked like they'd draw price, for instance >$300 because of the whole/centennial number's psychological value and the probability of longs buying a breakout and in doing so, creating supply to sell/short in to for institutional/smart money with their huge positions.
Earnings in particular with the gap up the next day, looked a lot like churning/distribution. Churning is a process in which strong hands pass shares to weak hands, it's characterized by: 1) a level where retail would buy, for instance on a breakout above a significant level 2) significant volume above normal 3) Little progress made on the day between the opening price and the closing price (often close lower or will have a large upper candlestick WICK) 4) and typically no follow through on the move.
AMZN's 3C "Trend Version" with significant negative divergences at each of the levels in which we would expect to see retail get involved in some size,
the leading negative at earnings is especially troublesome.
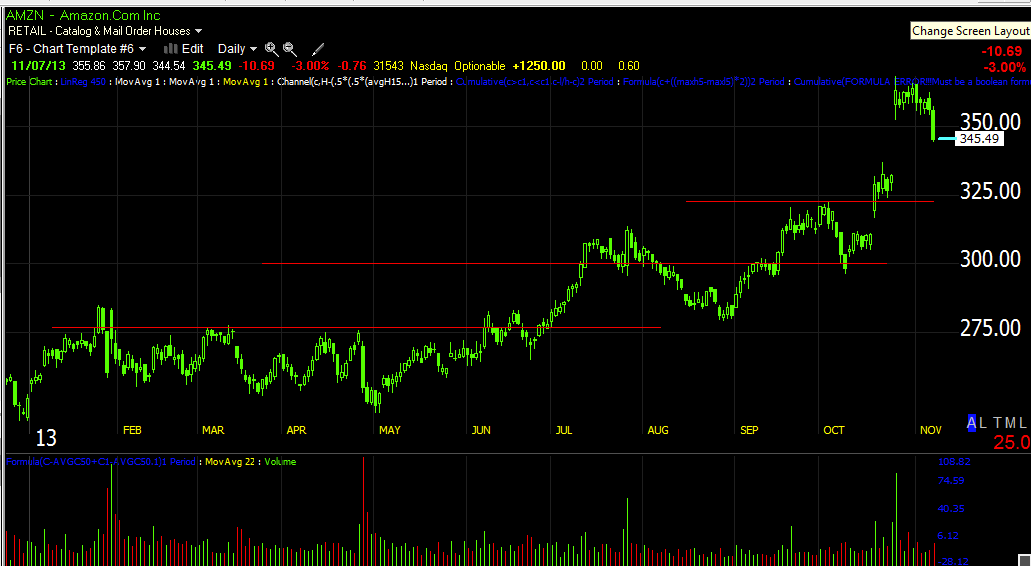
My Trend Channel with 1 stop out in red on a closing basis, then two "Channel Busters" which often look to be very strong moves, but often fail quickly and move to the lower end of the channel or worse.
The issue with "Channel Busters" is a "change in character" as changes in character, "Precede changes in trend".
Almost every top you look at, you'll notice an increased Rate of Change on price's upside move just before entering a stage 3 topping phase.
Several of the levels we were watching starting from the bottom up- The very obvious range which would attract retail buyers on a breakout above such a well defined resistance area. $300 as a centennial and whole number is where limit orders are often placed or where traders look for a move above or through that level as their psychological trigger. Resistance at the $325 area started looking too well defined not to take it out.
After that AMZN popped on earnings.
Note the volume the day after earnings, the candlestick with long wicks and no follow through with small bodied candles or what would sometimes be called "Spinning tops" and bearish engulfing or "Dark Cloud Cover" type candlesticks defining the days that did have larger real bodies.
The 4 hour chart had plenty of time to confirm the earnings gap up, it never did
The 2 hour chart has more detail, it would have been able to confirm even faster but it never did.
The 60 min chart zoomed in shows a clear leading negative divegrence starting right at the earnings gap up.
The 30 min chart acting the same way. The confirmatory-like trade ending right at the gap up and a flat range which is where distribution (or accumulation, depending on where the range is) is most often seen and a leading negative divegrence even with a fairly strong move down.
The intraday trend shows a trend of distribution, but a very increased ROC on the earnings gap up.
The very short term intraday 1 min looks like AMZN "may" offer a better entry for a short on a shake-out bounce.
Since former support (now resistance) is pretty well defined around the $354/$355 area, it wouldn't be uncommon to see a shakeout move of today's new shorts who chased the move. You may want to set some price alerts for any significant upside to look in to either starting a new position or adding to an existing position so long as there's room in your risk management and that was your plan and not as a function of "Dollar Cost Averaging" that falls outside of your risk management or creates a position larger than your pre-defined maximum risk.


No comments:
Post a Comment