Just so you know, despite the SPX having the WORST start of the year in NINE YEARS, the short term trend we prepared for Thursday and Friday which is linked above and essentially confirmed in the "Week Ahead" post (also linked above) was for the market to pick up this morning where 3C left off Friday, that was with intraday negative divergences and the concept dod not disappoint today.
I thought that this initial negative trade in to the first half of the day as expected in to the close Friday and last night, would give way to a more positive trend during the second half of the day as summed up Friday in this post which is very clear about short term expectations (and I mean short term as in short duration). Those charts are very clear, they suggest a short duration bounce which we prepared for by opening some call positions, some leveraged short gold trades and some long positions. I did not close shorts in the trading portfolio, but rather hedged them with the longs mentioned above.
There's a reason for doing this and that's the AAPL effect, when things get this ugly, this fast, it doesn't take much to create a panic and since the bulk of the carry trade seems to still be open, it doesn't take much to create a panic when you're operating at 100:1 leverage, so I wanted to make sure that short exposure was intact not only for longer term core positions, but even for the trading portfolio which is much more nimble.
My end of day Market Update today essentially said the expectations are still the same for a short duration bounce and the following trend to be extremely ugly on the downside, just the timeframe was stretched by what will probably be half a day. The reasons for the expectation of a bounce can be found using the link just above, the trend following that expectation can easily be summed up with a single chart although there are plenty more, the SPY 15 or 30 min which I mention because I showed them several times.
Just going by multiple timeframe analysis of the SPY alone, we can sum up expectations and therefore prepare for them as we already have in the case of the first one.

There was resistance around 2:45 as the averages pulled up to Friday's close and then a pullback, which I mentioned earlier today, is likely just a move toward the intraday lows before the first move gets under way.
Leading indicators as posted at the EOD today seemed to confirm that, I checked them after the close and they still do.


You can see as well that we have a little consolidation in 3C right now, that makes sense if we are expecting a bounce of some sort which I am as evidenced by the positions opened Friday and even today, but the damage is done and I suspect it gets much worse in to any upside. I don't think the worst start in 9 years for the SPX and this divergence are separate events.
Interestingly, considering expectations and the fact expectations are running about 3 hours behind, today's Dominant Price/Volume Relationship was not only dominant among each average, but the same among all averages and fits perfectly with expectations as the P/V relationship today broke down like this.
ALL Averages closed with a Dominant Price / Volume Relationship of Close Down/Volume Up. This relationship suggests that we have reached a short term oversold event, it's similar to a Morning Doji Star Candlestick on heavy volume (high probability short term bullish reversal).
The Dow had 18 of 30, the NASDAQ 100, 66, the Russell 2000 had 806, the SPX had 292 so it was a dominant theme and fits well with the general analysis as well as today's update to the timing.
There were some candlesticks that didn't have that same continuity and made the averages look displaced from each other and without knowing the Dominant P/V, I might be concerned about that situation, but as it were, I am not. For instance, the IWM's closing candle was a bearish Engulfing candle on significant volume while the QQQ formed a near perfect bullish Hammer (bullish reversal candle), the lower wick was just a bit short compared to the real body, but again it's the psychology and concept these patterns represent, so they don't have to look like the text book, so long as you understand the psychology of what they represent and in this case, the Price/Volume relationship is right on track with a candle like the NDX/QQQ, .in fact it is exactly what I'd expect to see.
Well over a week ago I mentioned several things we need to keep an eye on, one was the Carry trades and the Yen, we've already seen divergences that confirm the cover of the carry and then we got real news that BofA covered their USD/JPY cover which is not like a GS rec'd, this is a fact we can prove by their SEC filings.
All of the Carry trades, as mentioned last night are getting ugly, some of the biggest downside moves they've seen that are not like formed slight pullbacks.
Also the market is losing its correlation with these pairs.

This may also be why it see,s the carry cross is following the market rather than leading it. There seems to be a much greater correlation to the Yen, go straight to the source as I also said last night as the Yen (at least with 3C) will reflect underlying trade long before it shows up in the carry cross's price action.
That being said about the carry pairs, they do look to be in a slightly oversold state so a bounce would not be surprising which may be just enough to give the market enough room for its own bounce. This gets to be one of the trickier areas of the market when such fundamental base investments such as carry trades all of the sudden become a large liability, they can effect the market in dramatic ways very quickly because of the kind of leverage attached to them, so it's not a market environment we get to see very often, but it is interesting, it's challenging and if played right, it can not only be navigated, but very profitably navigated.
As for futures right now, intraday 1 min are largely positive, only NQ looks different and a bit shaky, but it's always the 5 min charts that I'm most interested in as far as short term trends and holding up overnight. We have the 5 min positives in the Index futures which is a big part of the analysis and short term positioning including hedging. I think not only will the Yen be interesting to pay attention too, but short term VIX futures and VXX will be key to timing this market and the first trend as well as subsequent ones.
If anything changes dramatically tonight, I'll let you know, but once we have a 5 min Index Futures divergence locked in, it's pretty rare for it not to play out and we are well positioned for that.
In fact... Last night I showed the Yen 5 min chart and while not looking horrible with a nasty negative distribution, there is a relative negative on the 5 min chart (confirming the 5 min Index futures) that looks like the Yen could get a little breather, I also posted the stronger/longer charts like 30 min that show the move higher in the Yen appears to be just starting, this would fit with trend expectations of a short duration bounce followed by something much nastier. Although that doesn't translate instantly over to the Nikkei 225 futures, I would and did take a look and found they look ready for a short duration bounce as well, however their longer, more serious charts which would be the next trend in multiple timeframe analysis are solidly negative which confirms so much from the averages to US Index Futures to credit, Leading indicators, currencies, etc.
As mentioned I double checked Leading Indicators after the close to make sure nothing was out of line with today's market analysis and the only changes I found actually made today's market analysis all the more probable.
For instance, as the market sold off a bit after hitting resistance at Friday's close, HYG (High Yield Corporate Credit) which is most often used for short term manipulation of the market, actually went nearly vertical. The arbitrage effect of HYG is based on its price, not underlying action and the underlying action shows significant distribution.
As you saw in the Market Update from today that included Leading Indicators, regular High Yield Credit which has no correlation to any arbitrage or manipulation scheme showed an excellent short term positive divegrence suggesting the market bounce we prepared for, however if you look at the rest of the analysis on HY Credit,you'll see that's one piece of the analysis, the smallest and the rest of it is quite ugly for the market so again keep in mind multiple timeframe analysis and the multiple trends it represents, so as far as our expectations, HY Credit is right in line with all of them.
Another thing I found very interesting was the severe underperformance of VXX (short term VIX futures) locally, this is a correlated arbitrage asset like HYG, it just needs to move in the opposite direction to support the market (weak).

In any case, I haven't seen relative performance this poor in a while.
Yields are an excellent leading indicator, however what I found was they offer no direction as they are in line with the SPX, they (both assets) have reverted to the mean, this means Yields won't help or drag the SPX lower as they stand, however if thy keep moving lower as they have been and the SPX does bounce, then they would be exerting bearish pressure on the market once it bounces.
Sentiment also is a nice Leading Indicator, the longer or stronger charts are clearly negative, the intraday charts are quite boring with almost no discernible trend and that's not to say they are in line with the SPX, they just seem to offer no support right now, nor are they heading straight down. My interpretation of these are they are not going to take the chance and go positive (pros buying short term) because of the risk, the same reason I hedged the trading shorts rather than closed them and they are not headed straight down as I suspect they expect the same as us, a short term bounce. We'll likely know if this opinion is correct if we see them turn clearly down on any market price strength, no matter how short (well at least 3/4's of a day).
Other than that, there's not much to go over that wouldn't be repetitious. However I did want to show several assets we are involved with and/or may be involved with.


While we're on precious metals, I needed a hedge for the trading portfolio which is equities (ETFs) only so while options would have been most effective, I chose to set up this portfolio using equities only, I needed something that would move opposite the market and hedge the short positions, but also had some leverage so I chose Gold/GLD as the underlying asset and the 3x leveraged short, DGLD as the trade.


I also chose an AAPL long as a hedge for the shorts in the trading portfolio as well as an AAPL Feb. $560 call which could work as a hedge as well, I just don't allow it in the trading portfolio. The reason I chose AAPL (equity long) for a hedge was not because of its beta or leverage, in fact I was disappointed that AAPL was the best I could find at the time and that's the reason I chose AAPL, it was by far, the best looking long at the time which was Thursday and Friday. Even today, the industry groups like XLF (Financials) and XLK (Tech) do not look good therefore I could not choose their leveraged ETFs as a hedge because they really look like they'll be lucky to float with the market, in fact although I don't expect it because of the market's pull, I would not be surprised if TECH and Financials were down even during a market move higher.

Here the 5 min chart shows a leading positive divegrence so both the AAPL long equity position and the AAPL February $560 call should make money. In addition to the beautiful 5 min leading positive 3C signal, today also gave us a head fake move which was effective as volume swelled as stops were likely run right through on the open as well as the odd short here and there.

I was correct to stay away from AAPL as it hasn't done anything in about 5 weeks, but this 30 min chart shows a significant change in character as it finally broke away from trend confirmation and started leading negative in a big way.
While the short term trade is long AAPL, I feel there's a high probability as we wrap that long position up, we'll have good signals to look at an AAPL short trade.
MCP was entered long today using January $5 Calls

As mentioned, longer term core positions were left as they are as I see no reason to run up transaction costs and maybe miss part of a nice move simply because the asset is likely to undergo a normal, healthy correction.

Two things, 1) I used options for the leverage as I see this as a short term move that is not connected to the market and 2) while I'd usually go for February calls (or at least 6 weeks before expiration), I chose the less expensive January because I really think this will be a very short duration upside move and wanted to get the most bang for the buck.
"IF" MCP drops below the $5.67 level tomorrow, I'll double check it to make sure it's a head fake move (as I expected one today) and if so, I'd add the second half of the position entered today to bring it to full size.
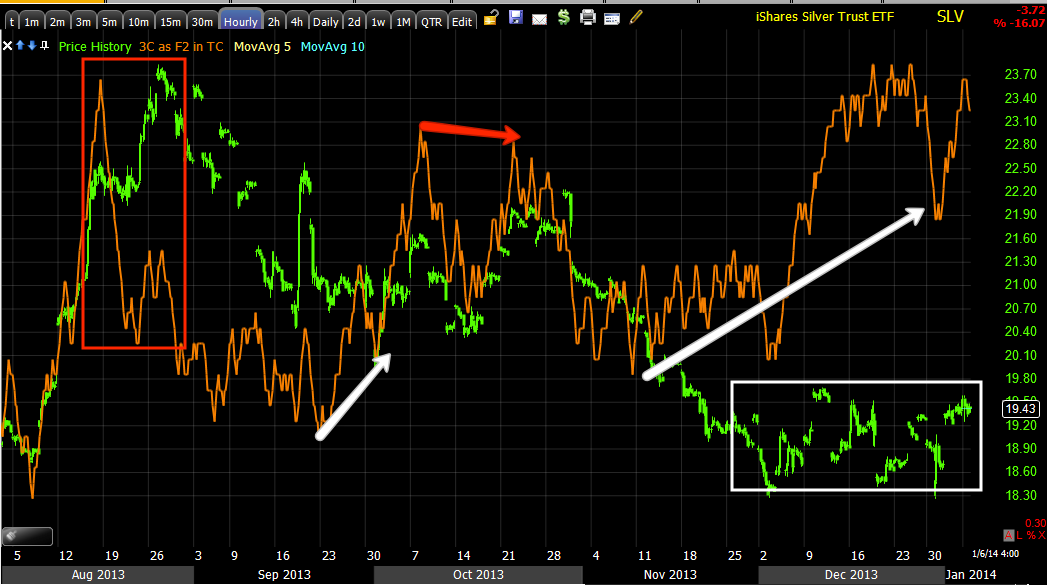
DGAZ is a long position which is a 3x inverse Natural Gas pullback play on another one of my long time (long) favorites, UNG.


The actual base in white or for UNG, toppy area in red, look like it could see more short term chop, but I think there's a clean trend once there's a breakout or in UNG's case a pullback below the toppy area.
So DGAZ is not a position I worry about from day to day, as long as the signals are there, I'm patient with it because I think it will deliver a superior gain with its 3x leverage.
However I chose to leave the trending/core UNG long positions open and would consider either adding to UNG on a pullback or opening a new long trading position, but until then, I'm patient and confident in DGAZ for a trade somewhere along the lines of a swing trade, maybe a bit longer.
Although we just got out of TWTR short (entry on December 26th and covered the short on December 30) I feel pretty good that we'll have another crack at it. I believe TWTR was downgraded this morning, thus the gap down and it traded in what some might call a small bear flag. The thing I noticed was the 1-5 min charts were all in line with price, not seeing additional distribution, so it may fill the gap or it may even make some sort of head fake move higher, but we have 3C signals on it that are showing larger distribution. When we entered TWTR for our first trade there it was 100% based on our concepts regarding parabolic price moves, we got in at nearly the top and exited as it was just about at its lows for a nice little trade, but now we have 3C signals so this is one that's hot on the radar.
TBT long (2x leveraged short 20+ year treasuries) is another shorter term position we entered today, if TBT will pullback toward today's intraday low, I'd be very likely to add to the TBT long and/or consider perhaps a TLT Put. That being said, I was just talking last night about a pullback in the long, unleveraged version of TBT, TLT, which has been on the radar a long time. It now is looking like it's preparing for a set-up and move so the pullback in TLT is welcomed as I'd like to enter TLT long (I'll likely short TBT to get the 2x leverage), but until then, TBT looks like a decent play on a TLT pullback.
There are quite a few others I'll be covering likely tomorrow including PCLN and NFLX.
I feel good about our take on the market, the management of positions and the set up of portfolios for multiple trends while also respecting the possibility of a black swan event as it is rising.


No comments:
Post a Comment