Right now it's not the USD/JPY that the correlation algos are following, it's the AUD/JPY.
This is a 1 min USD/JPY (red/green) vs ES chart. The longer term has seen USD/JPY as the dominant leader...

This 15 min chart of USD/JPY v ES shows the correlation over a longer period has been a dominant one, however near term, it's the AUD/JPY...
This is a 1 min AUD/JPY (red/green bars) vs ES (purple), however even with the correlation ES has exceeded the relationship this morning which is common for a head fake move.
The 3C chart for AUD/JPY is similar to the USD/JPY...
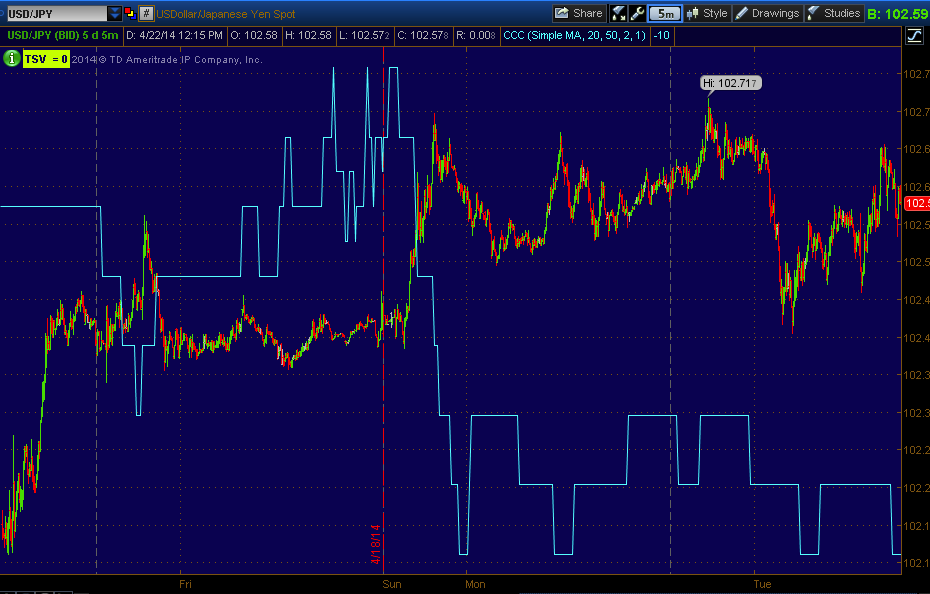
USD/JPY 5 min 3C chart still leading negative
As is the AUD/JPY which would seem to indicate that the market will lose this support as well (HYG is the other lever that went south yesterday).
Even intraday (1 min) there's a negative bias to the AUD/JPY.
For a closer look we need to look as the individual single currency futures, the AUD and JPY.

Intraday it looks like the $AUD is losing 3C support which makes sense considering the price movement very recently today in AUD/JPY.
The 5 min chart is still in line, the probable concept here would be migration of the divergence, meaning the 1 min getting worse and infecting the 5 min chart.
As far as a roof on the AUD/, it looks like there's one at 15 min below..
There was a definite positive divegrence, likely as the AUD was getting ready to take the helm from USD/JPY, but that seems to be seeing strong distribution. We do have some Asian/Chinese data coming out this week, HSBC's Flash PMI I believe for China which would be a major influence on AUD/JPY.
As for the Yen, there's not that much near term movement of importance, the 1 and 5 min charts are basically in line with 3C, but the larger picture (as in the carry trades losing support and the market losing support) looks pretty bad.
The 15 min Yen has gone from in line on the downtrend to lateral basing price movement with a leading positive 3C divergence.
The 30 min chart is also showing a leading positive divegrence in the same lateral basing area.
These charts have market implications for both the near term and for a larger (perhaps Primary) trend, that would likely be at least sub-intermeduiate to intermediate if not primary, meaning I'd be looking for a breach of the February lows which would be very significant for the SPX and Dow.
I'm keeping these on the radar today.


No comments:
Post a Comment