Being we expected a head fake move above the large multi-month range, it doesn't really surprise me that much that Yields continue to drop and ES is now even more severely dislocated as the USD/JPY's lingering period has started to end.
 USD/JPY 60 min chart showing the break of support at $102 and the 200-day moving average, then the lingering back at former support before a rollover again which should drop USD/JPY to a new lower low.
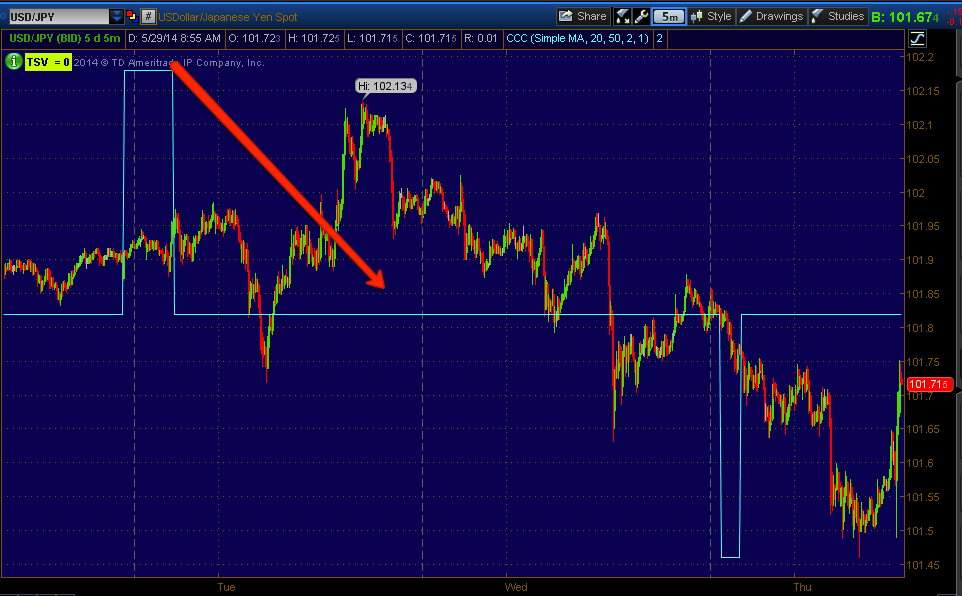 USD/JPY negative on a 5 min 3C chart at this week's highs before moving lower.

The USD/JPY (red./green candlesticks) vs ES/SPX futures, every other time there has been a dislocation in the correlation between these two, ES has reverted back down to USD/JPY, we have a pretty severe dislocation right now which would make sense as a head fake move with safe haven treasuries being bought and VIX holding its ground in a bid for protection.

You can see the inverse (nor,al) relationship of Treasuries (red/green) vs ES (purple), although both are still trending higher, at the yellow arrow, recently at the green arrow, they are both trending higher as there's a risk on trade in equities which I believe is simply the head fake move this week capping off the bear flag sling shot short squeeze and at the same time a Risk Off/Flight to Safety trade in Treasuries with Credit also in retreat.
The last time the 10 year Yield dropped (10 year treasury gained) and the market had this same strange correlation, was 2011, this is what happened next...

This is a daily chart of the SPX from 2011...the market lost nearly 20% in a flash...
This chart looks very similar to the large multi-month top/range we just went through.
As for G1 GDP second estimate, the F_E_D's trillion in QE3 bought the US economy a -1% Q1 GDP decline (down from +0.1% initial and -0.5% consensus).
That means if this negative print sticks, one more quarter and the US is officially back in recession.


No comments:
Post a Comment