Perhaps for the F_E_D minutes? You'll see a pretty clear theme today, it's not one of much action either positive or negative, but rather just enough to stall price and in this case that means it's slightly more positive action, but not the kind that (at least not of yet) sets up a strong move or is repairing damage from yesterday, in fact only the Dow/DIA has a somewhat positive look to it, but this has been the case since we first saw signs of a positive divegrence market wide on Friday which has done little more than to add to the chop, the DIA "could" be a worthwhile position, but it's still a bit difficult to imagine considering the brick wall of chop the market has seen the last several months.
As far as USD/JPY, there's very little action there as mentioned first thing this morning.
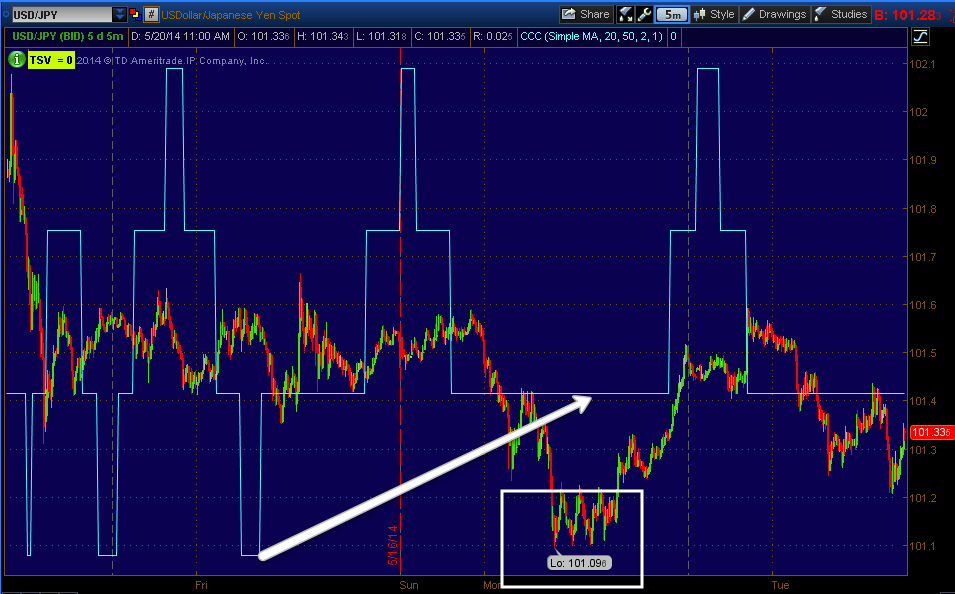
This is the 5 min USD/JPY, other than yesterday's lows, there's not much going on here, in fact if anything the intraday charts are leaning negative.
The single currency components of $USD and JPY (Yen) are just about as dull, it's more of a race to see which one is weaker.
Yen 1 min intraday, with Yen downside the USD/JPY "could" see some upside, but there's a second currency to the pair, the $USD...
As I said, it's almost as if it were a race to see which were weaker, it's hard right now to imagine the USD/JPY doing anything to support the market.
As for Index Futures, there seems to be more going on in their divergences and those of the averages as far as what is actually causing "some" movement or perhaps it's better to say a "lack of movement" as yesterday did not end well for the market, it's as if it has a lifeline right now.
ES 1 min positive near the open.
However like the averages that saw deterioration to some surprising timeframes yesterday in a surprisingly fast manner, the 5 min chart is clearly negative, forecasting near term weakness as the most probable trend.
NQ/NASDAQ 100 futures 1 min are in line
The 5 min chart is the closest thing to bullish among Index futures, it's really closer to in line, but there is a slight positive there.

Russell 2000 futures saw weakness overnight and in the early a.m. hours, they are close to in line intraday, but again...
The 5 min chart is showing VERY clear weakness forecast in to the very near future.
As for my custom NYSE TICK Indicator, I chose to look at a slightly longer scale at 5 min rather than 1 min...
The breadth improvement last Thursday and Friday leading to yesterday's recovery of the gap down has deteriorated both yesterday and today.
Intraday breadth among NYSE stocks is slightly more negative at >-1000 while the upside is right around +750.
DIA 1 min weakness in to yesterday's close and a very minor positive this morning, this is the "Stalling" looking behavior.
DIA 2 min with a negative yesterday and again the stalling behavior today.
As I mentioned last week as well as yesterday, the DIA still looks the best overall for underlying trade, if there were a hitch-hiking trade available among the averages, I'd expect to find it in the blue chips/Dow/DIA.
DIA 5 min
IWM 1 min w/ yesterday's weakness and just enough to stall today.
IWM 2 min leaning much more toward weakness from yesterday's action.
The IWM was probably and probably still is the second best looking of the averages, but still negative (relative) on this 5 min chart.
QQQ 1 min with very little help today.
QQQ 2 min much the same
QQQ 3 min, the same
And QQQ 5 min, the same.
I still have the SQQQ (3x short QQQ ETF) as an open long, although I'm not expecting too much until we decisively break through this chop.
SPY 1 min with yesterday's damage and just enough to stall today from seeing more downside.
SPY 2 min
SPY 3 min is not seeing any strength from the 1-2 min charts, thus the stalling look and not repair.
And the continuing weakness in the 5 min charts (SPY).
I suspect this is about tomorrow's 2 pm release of the F_O_M_C minutes.


No comments:
Post a Comment