As far as price action and motivation, there may be some stalling in front of the ECB event, but this is also perfect staging (4 trend stages). I've seen internal research from a LARGE Wall St. firm, I though I hit the jackpot as it was research disseminated to their various trading departments, but when I tried to follow some of the general ideas/trades, I was getting slaughtered, I finally gave up on it. About 6-8 months later I found it laying around and for kicks looked at it again, saw what it said and checked the market and assets covered in the report and wouldn't you know it, there were moves all in the direction of their recommendations. What I didn't understand and what I try to pass along with concepts like the "Reversal Process, Staging, Head Fake Moves, etc." is that Wall Street works months, sometimes years in advance.
Some of you may recall the homebuilders charts from 2000 that were under accumulation for a good year and a half as the Dot.Com bubble was exploding, the same time homebuilders were quietly being accumulated and who would have ever guessed that after the tech revolution that changed our lives (the Internet was nascent before that, far from the staple of life it is today) that boring housing that generally appreciated 2-3% a year (other than some hot areas) would lead the next bull market (home equity supported Consumer Spending) with some of those homebuilders gaining +2500% and they didn't really get off the ground until 2002, talk about forward planning, who would have ever guessed after the tech revolution?
The point being, I don't think it would be difficult for Wall Street to put in a stage 3 area as the market has been nearly unchanged the last 4 days (nothing more than little over a 1/10th of a percent yesterday) and have that coincide with a waiting period before Thursday's ECB policy announcement that has very high expectations and thus a very high probability that it will disappoint.
The other issue I mentioned Friday was the numerous stocks on my watchlists that all look good for a trade generally speaking (most short), but I decided to hold off filling most of the positions out or throw out new ones because we know conceptually the reversal process is part of what we need to wait for to complete. The market holding at near unchanged allows that reversal process to finish up.
Here are a few examples of what I see from the last several days and this morning...

So as we saw a bear flag forming with a positive divegrence, it looked pretty high probability that it would be head faked and Wall St. doesn't do anything without a reason. It further stood to reason (without having any specific objective evidence at the time), that a Crazy Ivan shakeout that creates a bear trap would force a short squeeze and give the market the momentum it needed to effect that head fake move being as most other levers had broken and there was accumulation in a 3-5 day bear flag (depending on where you count from) which was already telling us the probability was for a move up and since this large range hadn't seen a head fake move and since the 3C charts, market breadth, VIX near term action, Leading indicators and more were all deteriorating rapidly in this large range, a head fake move made more sense.
Here's the mechanics again even though I posted them yesterday.
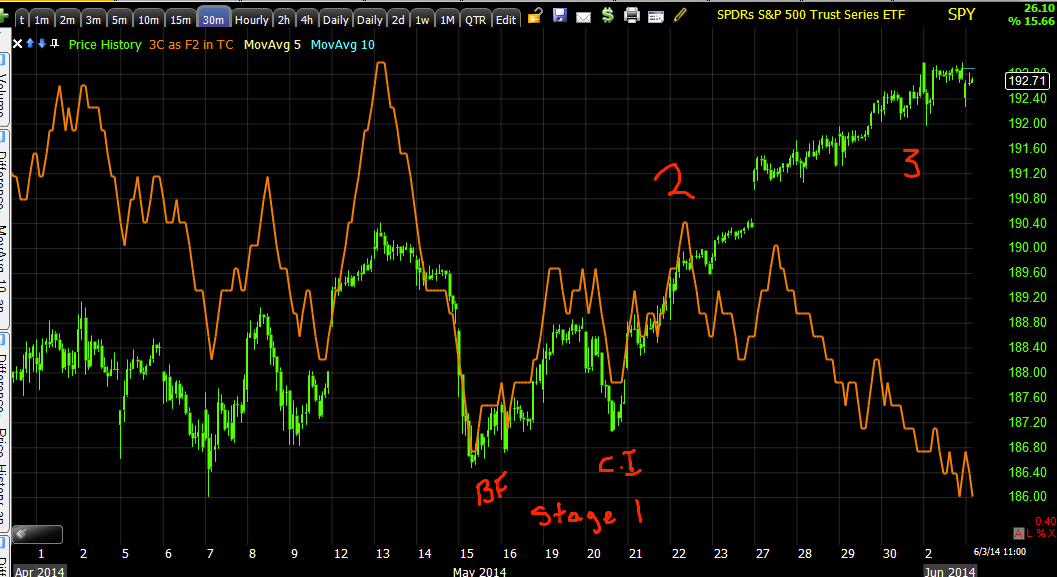
The exact same stages can be seen on the first chart of this post, note the rounding/flat reversal process area we are in the last 4 days.
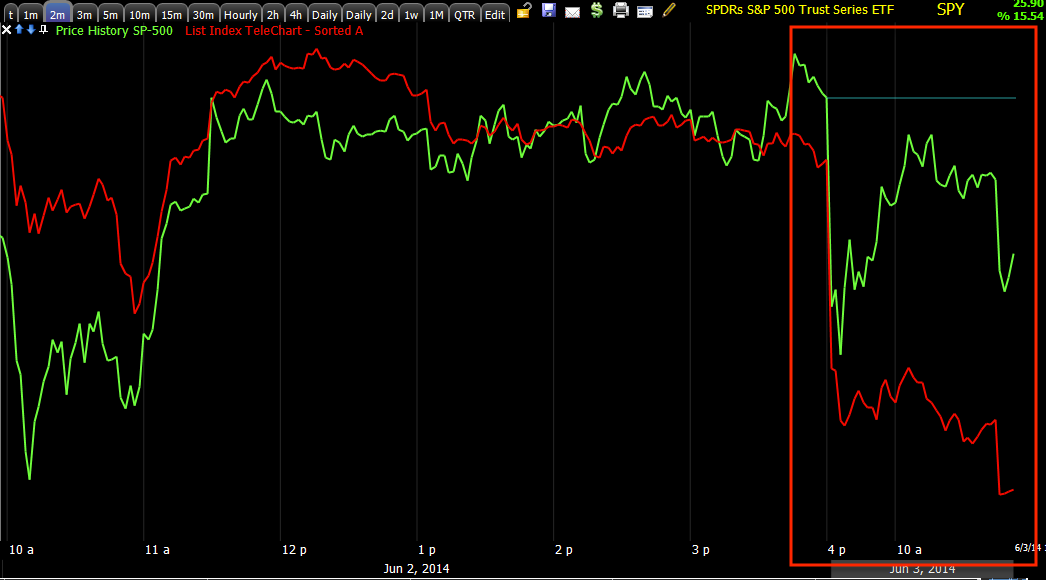
If you look at the Most Shorted Index, you can see clearly how a short squeeze created the momentum to break above the range and the chart above shows strong distribution as soon as price broke above resistance of the multi-month range.

A closer look...
As for the averages, I suspect they'll finish up or stay in position to allow numerous watchlists stocks to finish their reversal process, NFLX was the example given last Friday for what to expect this week at is serves as a good proxy not only for the watchlist , but the market as well. Forward Market Forecast and The Week Ahead from last Friday.


However as you saw last night, 3C was right on about distribution all of last week in large size as prices were above the range, the entire reason for a head fake move as Bank of America's research showed...3C Distribution Confirmed by BofAML
As for the averages this morning, more of the same. The short term intraday 1 min charts are steering divergences while the longer charts continue to deteriorate even worse which is also confirmed by the performance of the Most Shorted Index.


I expect this to likely go on for another day or so, perhaps in to the ECB. The longer this goes on, the more defined a range becomes or resistance level, the greater the chance of a head fake move above this smaller range, of course they tend to be proportional so the larger head fake move above the multi-month range would be bigger than a 4- day range's.
I'll have more and stock updates/Ideas.


No comments:
Post a Comment