For instance...
As expected this morning, USD/JPY (red/green) is driving and ES/SPX futures are following, yesterday it was AUD/JPY until that started to fail at the EOD. There's no major divergences in USD/JPY as of yet so it should keep moving to the upside.
The objective of this bounce is to sell/short sell at the best levels which are typically graded by institutional investors (who typically hand off larger positions to be filled by specialists or market makers in the particular asset) using VWAP, the objective of the middlemen is to sell/short sell at either VWAP or the upper standard deviation as has been the trend for the last week or so.
The TICK data however is pretty tight with nothing above or below +/- 1000, intraday market breadth is much poorer than the market averages appear.
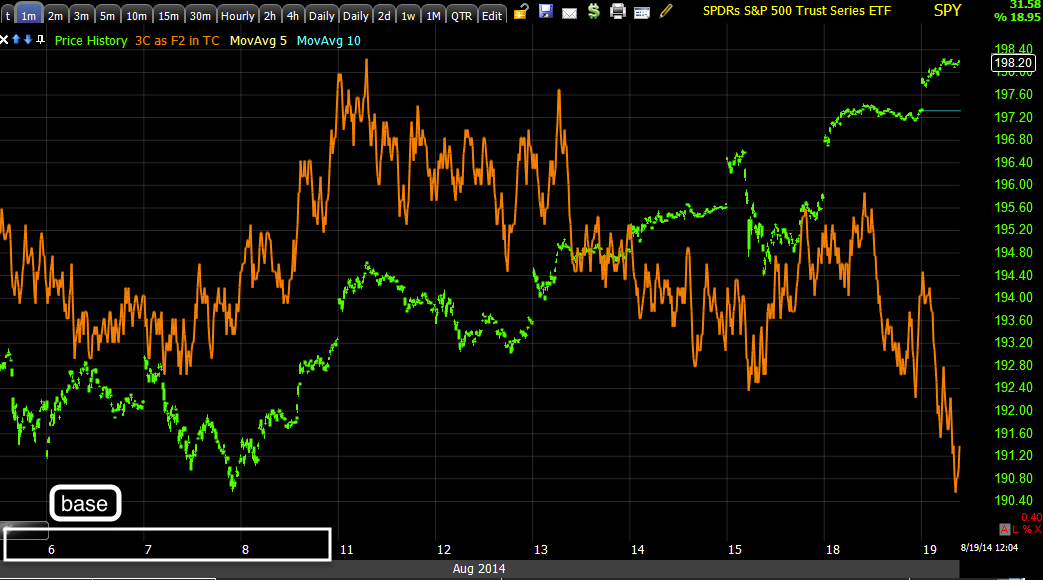
SPY intraday has hit a new leading negative divegrence. Below is the trend during this bounce, it's pretty easy to figure out what's going on between volume, 3C, VWAP, but it was pretty easy to figure out even before the base was mature.
Here's the trend of the intraday chart, positive in the base and since mark-up, distribution started almost immediately. This is more of an art than a science, figuring out how big the base is, how strong the divegrence is and essentially breaking it down to "How much gas is in the tank for an upside bounce?" and how much has been used up already. The 3C chart above gives us a pretty good idea, no time was wasted in selling in to any move higher just like the last two bounces since July 1st when there was a very definitive change in character leading us to NYSE breadth readings that were worse than most bear markets.
This isn't a signal to take action, it's confirmation of the distribution trend and that we are on track. I'll see what else is going on and take a look at the watchlist to see if there are any significant changes among a majority of stocks in my watchlists.


No comments:
Post a Comment