Good morning.
Right off the bat I'll ask for your understanding with my lack of enthusiasm today, not to be confused with lack of diligence, it's just these weekly option expiration Fridays are as boring as the monthly expiration, they all tend to pin right where the market closed the Thursday before, take the SPY today for example...
On the daily SPY chart, today's open is just about at yesterday's close and typically the max-pain op-ex pin which shifts through the day as different contracts are closed out, tends to stay within a pretty narrow range until about 2-3 p.m. as most brokers have got their clients to wrap up positions before the last hour of the day and that's when the op-ex pin tends to be lifted, until then, it's typically pretty dull, pretty boring.
After that time though, the market can and will do whatever it wants, it's the 3C data the last hour or two that is some of the best data of the week, making the week ahead forecast pretty clear, although I think we already have enough data to suggest what the direction of highest probability is for next week, DOWN. Still, the 3C signals at the close tend to pick up right where they left off the following trading day, even over a 3-day weekend, but until then, it's pretty monotonous.
As for early indications and the most important charts of the week, from a 3C perspective any way...
SPY 1 min, which is more of a steering divergence intraday, but from a trend perspective like this, is an excellent timing indication of a reversal as it puts in a divergence trend like this negative one after earlier in the week confirmation. Remember we had a long UPRO/FAS call out Oct. 14th, the day before the final low and then rally. We are not about catching falling knives, but when you follow the money flow that moves the market, you'll have early/advance notice nearly every time.
Note the last 3 days in SPY and 3C, now look at the daily chart...
Those same 3 daily candles show the same negative character.
The 3 min trend is useful on its own or as confirmation of the migration of the 1 min divergence.
And the 5 min trend is the first timeframe where we see institutional activity on an intraday basis.
This 15 min negative is right on the borderline of having enough gas to push higher and maybe not.
As I said yesterday, any decline/pullback will have to show accumulation for a solid long trade if a base is to be formed, if there's no accumulation during the pullback, then I suspect we just saw one of the first bear market-style counter-trend rallies.
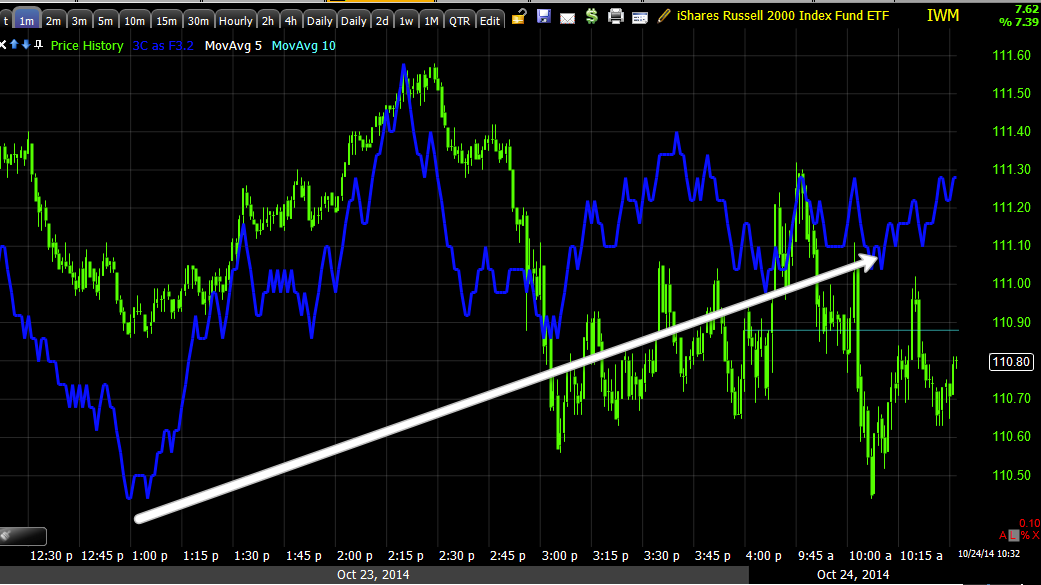
IWM 1 min is about in line intraday, slightly positive on a 1 min chart...
Here's the 3 min trend confirming SPY very well.
And the 15 min negative divegrence which is pretty serious, if it weren't for accumulation as early as Oct 2nd, I might be looking at this in a different light, a simple next leg down and that's it.
QQQ 1 min leading negative
QQQ 5 min leading negative
And the most important, 10 min leading negative...
this is why I say we don't really need the end of day information although I'll be looking for it, we already know what the most probable direction is.


No comments:
Post a Comment