This morning has the feel of another dull day, I'm not talking about price action, I'm talking about underlying trade. Here's the early indications, mostly in line with a few slightly positive readings, nothing very exciting.
SPY intraday this morning is slightly negative, I don't see anything imminent here, it almost looks like what I wished for or hoped we might see, even though I'd like to see the bottom fall out for some of my friends with nearby puts, I just think this is the most powerful end game move to the downside...
Since price above these moving averages is a technical buy signal, it seems the more time we are in the area, the stronger the bull trap is, although my logic may be faulty as many who intend to buy have likely already done so. In that case the only and and important reason to be lateral up here is a reversal process which has a lot more to do with the size of institutional positions and the time it takes to move them, their not like our 100 lot trades with larger firms having moderate single stock positions of a billion dollars and that's moderate.
Intraday the IWM looks pretty close to in line as well, you can probably see why I said today feels "Dull".

The QQQ is slightly more positive, but, THIS ISN'T ANYTHING VERY EXCITING ON AN INTRADAY 1 MIN CHART.
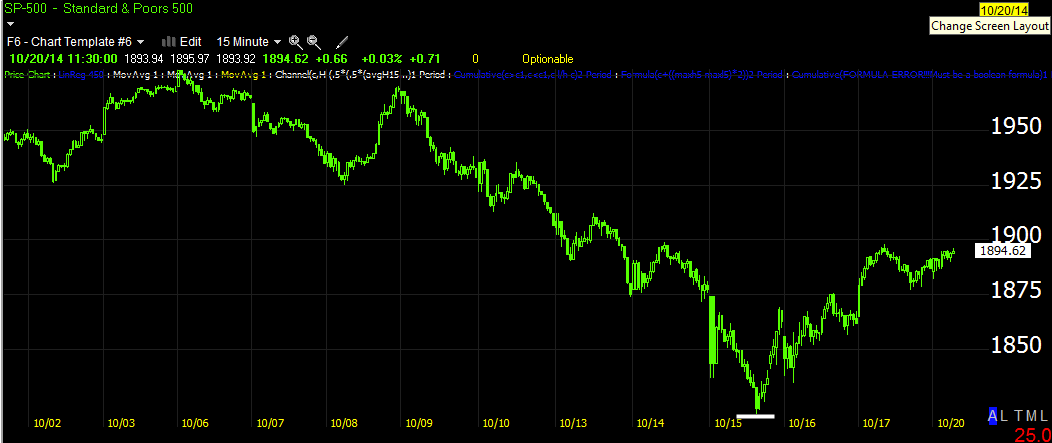
A little longer term SPY 5 min has seen damage in this area where a head fake/chimney move was made.
On a 10 min chart you can see the accrual of the trend and for perspective on that 10 min chart...
You can se it started showing heavy distribution in to the start of the rounding top and further distribution in to the Igloo/Chimney head fake portion.
As already mentioned, the 30 min chart's positive divegrence in the SPY is much smaller than the current negative, but as I have posted in looking back to before the move started, this move was accumulated, but also designed so Wall St. didn't have to do anything to push the market higher, the deeply oversold small caps and short squeeze was there, the area just a few days in to the move where retail wanted to short was run over causing more of a squeeze and sentiment was turned bringing in the buyers, still the point is the chart itself.
It's just a predictable process where as Wall St. use to buy the heaviest weighted stocks in an index to move it, they've found other ways that don't cost much at all, all based on psychology and the predictability of technical traders.
QQQ 2 min showing strong distribution in to it's chimney on the rounding Igloo/Chimney with the chimney being a head fake move keeping longs engaged in a market that was otherwise losing momentum as it rounded over.
Again, like the SPY, the QQQ 10 min chart shows the accrual of distribution at the area, this is reaching a new leading negative low below where 3C was before the move started.
Like the SPY 30 min the QQQ has a pretty large negative, it's not just the sharpness of the divegrence, it's the time. The positive going in to this move wasn't sharp at all, but it was a lot of time as you can see to the left.
IWM 2 min also confirming the distribution in to the "Chimney area". Interestingly although the IWM has the most internal damage, right now it's underlying trade looks the best on a relative basis of the major averages.
Here's the 10 min IWM chart, it's close to a new leading lower low, the large relative divegrence though is the main feature, this is a weaker form of divergence than a leading divergence, but still a strong divegrence, especially over the amount of time.
However on a 30 min chart, it has the best looking chart, still in line.
This is what I was pointing out early in the move, the IWM had a stable, large base capable of supporting a strong move whereas the SPX and QQ had weaker "V" shaped bases, compare below...
SPX AND NDX BASES very "V" shaped, not a strong base to build off.
RUT base, much stronger, even has a head fake move.
I'm going to look through specific industry groups while keeping an eye on the market. Watch out for complacency, the SPX chart of the base just above shows how quickly things change and they tend to do so just after dull markets.


No comments:
Post a Comment