You may recall that Q3 window dressing, the last week or two of September saw a lot of small caps sold off, after all , it's the "Art of looking smart", showing that these trading firms owned the hottest stocks at the quarter end report while dumping the dogs, which I suspected would create a deeply oversold and very cheap, very liquid way to play a countertrend bounce taking advantage of bearish sentiment which has been pegged at the most bearish among retail at zero on the Fear and Greed Index, 100 being the most bullish.
It looked like this...

From the stage 3 top, we had a negatrive divegrence or head fake (Igloo/Chimney) so the expectation that we'd hit stage 4 decline and make a new lower low from the August lows was high. The support area that formed a "W" in early October was a huge bull's eye target for a head fake move and ith increasing volatility, ATR, and unpredictability, we saw exactly what was predicted almost a year ago, HFT liquidity disappear as they have no legal obligation to be the buyer/seller of last resort like market makers and specialists (at market orders), but HFT has largely replaced all of their liquidity making it a dangerous downside situation as HFT's can just shut down, market makers' who have a legal obligation saw their role as liquidity providers marginalized by HFT and our prediction was in a downside move, HFT liquidity would disappear leaving the legal obligation to the marginalized market makers and specialists, essentially creating a worse market structure than has ever existed, one of the reasons I think the bear market argument is one of the strongest for the biggest opportunity anyone alive has seen as long as you are on the right side of the trade.
We also know FEAR as an emotion is stronger than greed, that's why markets fall faster and harder than they rise, just think of all of those all time new highs on +0.10% moves compared to what we have seen recently. Five and a half months of SPX gains were wiped out in less than a month.
However this left small caps deeply oversold as well as many other asset classes with large caps holding out the longest as they did in 2007/2008.
The 3C chart of SPY in the August cycle's stage 3 top shows the head fake "Chimney" attempted breakout/failed breakout, the head fake move, see a deep negative divegrence which is where the pivot was to add short trades like SRTY/SQQQ as well as longer term core shorts. The two trendlines, the first being the obvious "W" bottom was high probability for a run below and while we were there, the expected stage 4 new lower low was also hit as the second trendline was broken. Our downside targets were a break of the 200-day moving averages, but all of this supply and cheap prices also made me think that after Window dressing, when no one is watching or able to watch, firms would be buying up cheap assets for a bounce, taking advantage of the entire market on the same side of the trade.
As sharp as the move has been, and we'll have to get use to the new normal as volatility will only get stronger in a bear market, very different than what we have seen the rest of early 2014, it does look like that plan is still in effect and there are numerous signs we have a monster base, which it needs to be. After the initial 1929 crash, the first significant move was about a 6 month counter trend rally that made +50% in the Dow, there were at least 4 more on the way to the 1932 bottom.
As for the charts we have now, I stayed short until late last week when the risk:reward started to look a little scary and went to cash, only recently this week adding some partial long positions with most everything else cash, waiting for the right moment to enter as a move of this size would be well worth the trade, however I want strong confirmation, stronger than usual which is pretty darn strong just because of the higher probability of the market breaking, we are already seeing some of that in EDGE this morning with crossed quotes, the system just can't handle what's coming which will make it worse.
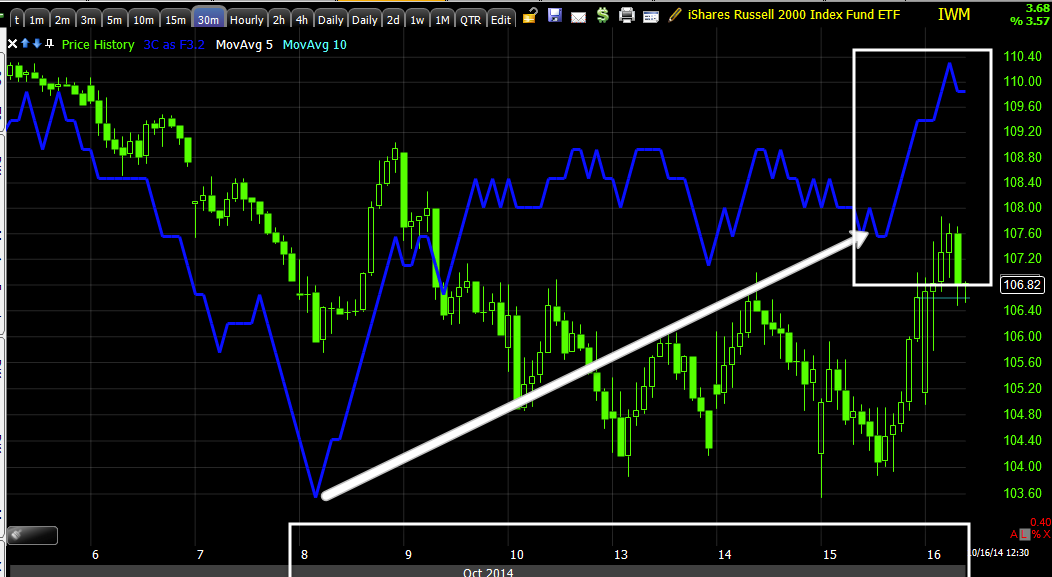
Right now the IWM looks the best which makes some sense being the small cap exposure.
This is a 60 min leading positive divegrence, this is huge as far as a bounce goes, not the typical several day bounce, but something that will change sentiment.
These charts also start on October 2nd, the 2nd day after Q3 ended and managers had a free hand no longer having to worry about what their portfolio prospectus shows for Q3 holdings which is always what they hold at the end of the month, it's a parlor trick and only works for so long with underperformance, but they do it every time.
IWM 30 min leading positive.
Once these larger strategic timeframes are in place, probabilities build and we start looking for the short term tactical timing timeframes like 1-5 min build in for actual entries/exits.
IWM 15 min trend, this chart alone is capable of a strong move and again, Oct. 2nd shows up as a start date. As hard as that may be to comprehend, smart money's positions are so large, it takes them time to put together a billion dollar single position and they need lower prices and supply to do it.
The IWm 5 min leading positive is what I've been looking for and also note the reversal process building in place.
I don't think a head fake move is needed as the decline did that job.
This is the 3x short IWM, SRTY, just for confirmation, it is leading negative at 60 min.
For me, a good reason to book trading gains there.
QQQ 60 min is positive, not as strong as IWM, but still a strong 60 min divergence.
The 30 min chart, again with activity starting as early as Oct. 2nd after Q3 ended.
3x long QQQ, TQQQ with a 10 min leading positive, also at Oct. 2nd as a start. The start of accumulation isn't a but signal, it's just showing us what's going on under visible trade.
And the more recent 5 min leading positive I have been looking for.
UPRO, 3x long SPX 2 min trend, also at Oct. 2nd.
SPY 2 min leading positive, also in to October 2nd.
UPRO 10 min trend positive, also Oct. 2nd.
I think this is a much bigger base than it appears to be, we'll know when (assuming we're right) is over as it would be a bigger upside move than what we've seen on the downside.
Still, I want to enter positions for the right reasons, that means strong signals even though we have other strong signals that have been very effective like SPX/RUT Ratio and VIX term structure.
Probabilities aren't the same as high probabilities/low risk trades.


No comments:
Post a Comment