As always I like to use multiple timeframe analysis and multiple asset confirmation for the best signals. I'll be using several long Financials and short Financials, if there's confirmation the short Financials should give a near mirror opposite signal as confirmation. Remember, while these assets are leveraged so they try to mimic the underlying by whatever their leverage may be (FAZ is 3x short Financials, FAS is 3x long financials), 3C is not following the price alone and therefore will not give the same signals just because their prices move together or directly opposite, volume is something the ETFs cannot recreate and don't try to, it's often in volume that 3C using Time Segmented Volume as input data, will create divergences, so this is something that is different for each ETF, even if they are connected by the underlying. In other words, if there's 3C confirmation, it has nothing to do with the fact that each ETF that is tracking an underlying as actual demand via volume is totally different for each one.
XLF/Financials is the main ETF, FAS is the 3x leveraged long of XLF and should move approximately 3x whatever XLF moves. FAZ is the 3x short financials and should move approximately 3x inverse of XLF on a daily basis. Thus XLF and FAS should have similar signals for confirmation and FAZ should have nearly mirror opposite signals for confirmation between multiple assets as well as multiple timeframes.
Although the leveraged ETFs often give cleaner, earlier signals than the underlying (I suppose because of the leverage, meaning smart money knowing about a move coming will move in or out of the leveraged ETFs first as to prevent losses or enhance gains),I'll be using all and try to keep timeframes close so you can see the confirmation. *Remember XLF and FAS should be similar while FAZ should be the near mirror opposite for confirmation.

From the October lows in which we forecast a monstrously strong rally over a week in advance of the bottom shows XLF accumulation at the mid-October lows, a strong accumulation signal, but since we have seen a 3C downtrend in to higher prices rather than confirmation with the most recent highs showing an even lower 3C reading, indicating selling in to this entire move and the highest probability resolution being down.


The longterm charts of highest probabilities confirm and suggest the strongest probability move is to the downside.
As for mid term charts, which show us whether we are close to the anticipated move...


As for the shorter term timing charts, I'm specifically looking for movement around the last day of Window Dressing for Q4 and FY2014 which would be last Friday considering the T+3 settlement rule as well as that being the first day of the Santa Rally which runs from the week after Christmas to New Years, again starting Friday. These shorter term signals are not as strong as the ones above, but they are essential to timing.


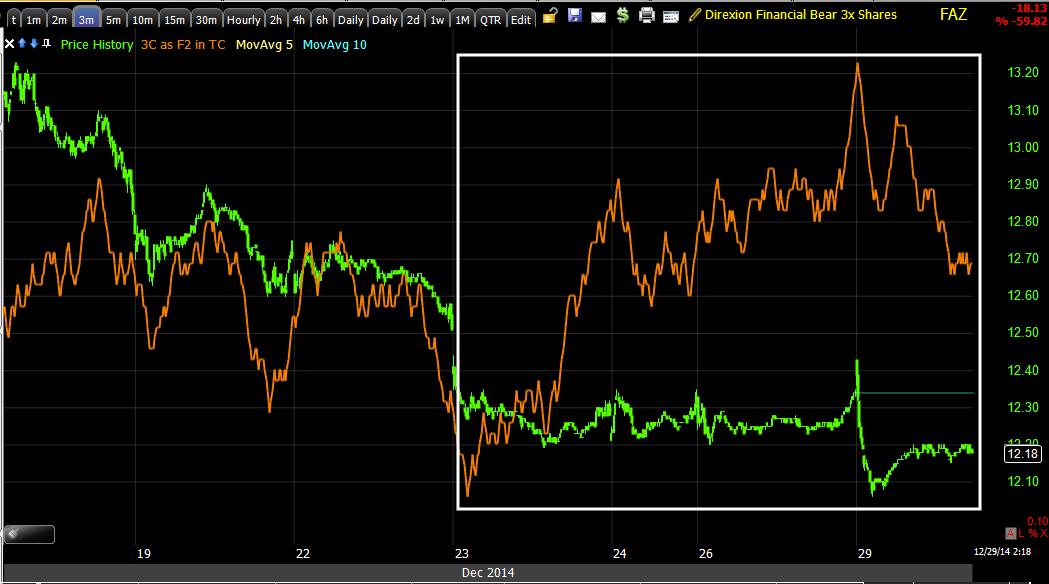
Intraday, 1 min is the only chart that bothers me a little. This is the weakest signal of underlying trade, but often one of the best timing signals. There's some divergence between the 3 ETFs here.


I don't feel that this small lack of confirmation is that important when considering the bigger picture and will go ahead and try to fill out the FAZ long position with whatever room I have left to add to it to bring it to full position size within the constraints of my risk management position sizing.


No comments:
Post a Comment