Friday I first posted my expectation that the IWM will break a 6 trading week range that had seen it move exactly -0.14% over the 6 weeks, it was based entirely on mass psychology, head fake moves and more broadly our concepts! Only -0.14% over 6 weeks? That's as flat as you get.
It's also one of the most enticing head fake areas you could ask for to create a bull trap and downside momentum. I have two links on the member's site going in to depth about the head fake move , why, when, how. The larger point is that these concepts are fractal in nature, can be used in any time frame and any asset because they all deal with mass psychology and the way Wall St. uses that to their advantage which is so predictable at this point that I had already fleshed out grounds for a move in the IWM above $118 as a head fake move before I had the first piece of hard evidence.
Here's the IWM as of Friday's close...

The very next trading day, Monday, after 6 weeks of not breaking the range...

We have the first break, a day after our theory starts to flesh out. A Crazy Ivan shakeout in which trapping shorts below the range creates upside momentum for a break out the IWM could not otherwise pull off on its own over 6 weeks. I showed an example of this Monday in XLF in the post, IWM Crazy Ivan
As I said, the concepts are fractal so no matter what kind of trader you are, they'll apply and they'll work because they are based on Mass Psychology, the two things that move the market- Fear and Greed which are what create supply and demand dynamics, thus the market in many ways is little changed over centuries because human emotion is unchanged, making how Wall St. uses that predictable if you understand how they use technical analysis and price action against you.
For example, a larger version of the same Crazy IVan/head fake move in the SPX creating downside, but that wasn't initially the perception...

SPX's Broadening top. Just like now, we predicted the October rally almost 2 weeks in advance and a week before we had any hard evidence which built up over the next week. The move below the top's lower trendline created an extremely bearish environment, perfect for a squeeze and strong move which changed traders sentiment and fueled the move itself, followed by an upside breakout making traders think the top is nullified with the breakout as Technical traders are extremely predictable to Wall Street's advantage. However that created a bull trap and you've seen the results last week with the worst weekly Dow performance in 3 years, the worst weekly SPX performance in 2.5 years.
I believe the exact same pattern is playing out or will in the IWM now.
We've been watching for the evidence to back up this theory since the new week started, we've seen it slowly build in the 3C charts of the averages and Index futures, but the market is so weak it needed the usual suspects, the market levers...Yields/Bonds, HYG, VIX and USD/JPY.
I've posted numerous times this week on all of them, for instance...
This week's: Daily Wrap, Averages, HYG, TLT Update , Quick Market / Leading Indicators Update, VIX Update , IWM Still VERY Much Within Striking Distance, Index Futures This Morning, Daily Wrap, Leading Indicators, What they Do and Don't Say, Quick Update- Change is in the air, IWM Crazy Ivan, Sunday Night Futures and the Week Ahead, MACRO TRENDS AND CHANGES IN CHARACTER, Planning Ahead, Trading Plan In to Next Week
These are just some of the posts that have shown the evidence developing such as Yields needed as a leading indicator to ramp the market and as such TLT needing to move lower.


TLT (blue) and SPX (green) with price inverted to show the correlation, TLT is leading the SPX higher today.
As far as the evidence in yields...which we have followed via TLT and Treasury bond futures...

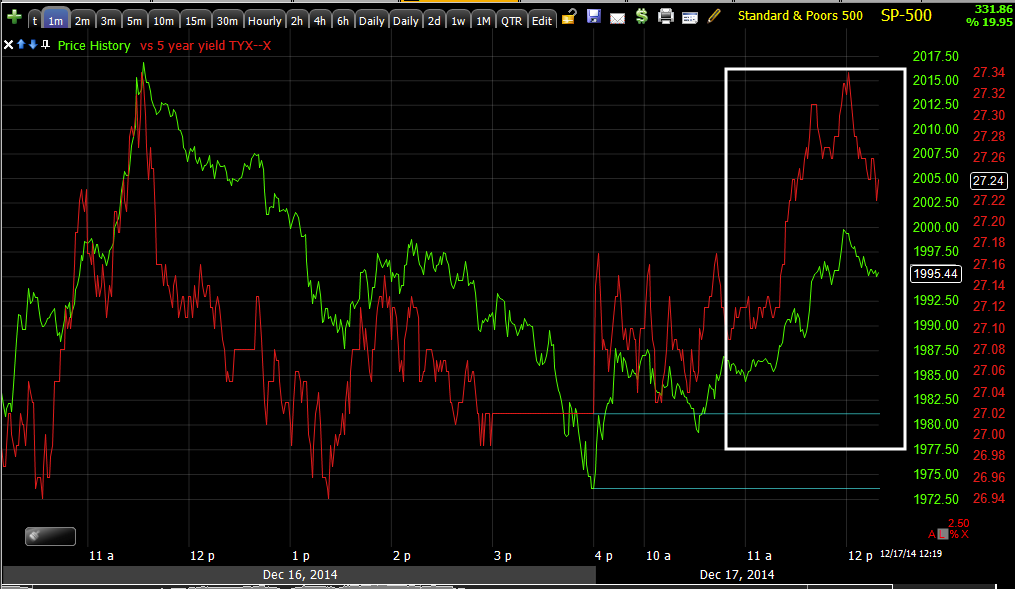
30 year yields, part of our TLT analysis are leading the market today as we have been forecasting due to 3C signals in treasuries.

The most obvious lever of all, HYG as there's only 1 reason to accumulate it as they have this week in such an environment and you see the reason on this chart as HYG leads the SPX higher as one of our best leading indicators.
VIX was the 3rd of 4, we posted a lot on this yesterday in VIX Update
And the 4th is the simple USD/JPY, which is also leading the market today.

Note how USD/JPY (candlesticks) really pulls ES / SPX Futures up (purple) at the cash open.
We have been making the case all week, but it started with no evidence, just a high probability, tight range that should see a head fake move before moving lower.
The relative performance between SPX and VIX was another signal in our SPX/RUT Ratio custom indicator and our VIX Term Structure, both supporting higher prices or giving a near term buy signal.
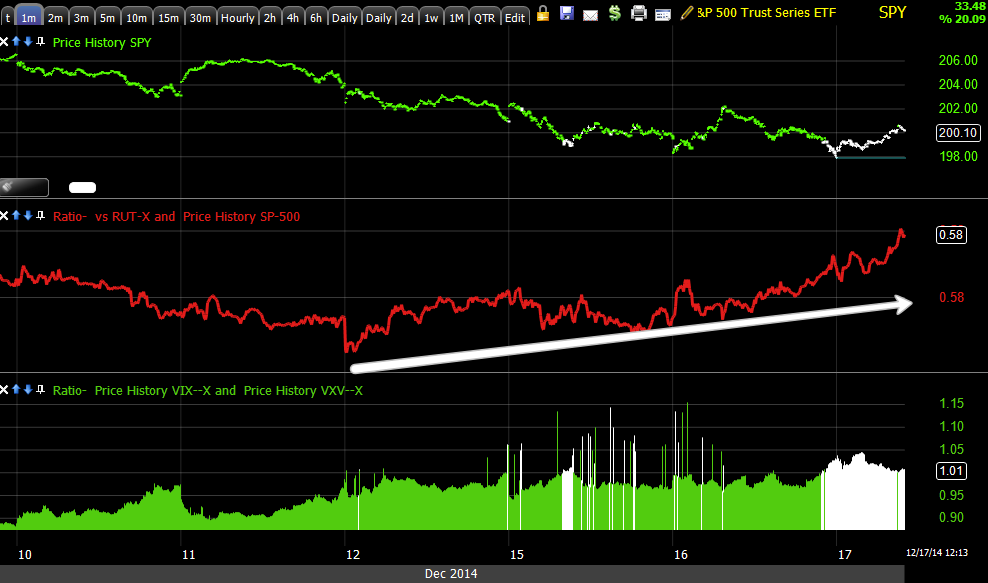
SPX/RUT ratio (red) has refused to confirm near term downside and I've posted the VIX Term Structure custom indicators recent buy signals this week (green/white).
And all for what?
Again, I believe the exact same thing I believed Friday and Saturday, the IWM range is too obvious, it'''s a simple head fake/bull trap set up that like the larger head fake in SPX above the broadening top, will lead to increased downside momentum making last week's decline (worst weekly performance in 3 years) look tame.
It all starts above IWM $118, that's where we'll want to be looking at selling short or adding to positions.
I have considered a piggy back long as I posted yesterday, Leveraged ETF's TQQQ/SQQQ and Leveraged Market ETFs: URTY/SRTY
However I just don't see the kind of strength that would prevent this market from gapping down suddenly, thus I'd prefer to keep managing my shorts and entering or adding to new ones at the trigger level which is a break above the IWM's range, around > $118...

The Crazy Ivan shakeout trapping shorts as price moves higher , creating a short squeeze which is already under way today and giving the market more upside momentum to make the breakout it couldn't over 6 trading weeks, is already in the books on higher volume. $118 IWM is the trigger level that we must at least reach, then we'll be looking in to short selling additional assets which I held off on last week and in retrospect, I'm glad as they would have been poorly timed entries considering what I believe we are seeing.
In any case the F_O_M_C is in less than an hour, while I don't think the signals this week and price move are an F_O_M_C leak, otherwise the averages would have more accumulation, price initially determines how the F_O_M_C is received even if it is very hawkish, if the market is rallying, the knee jerk response will be that it was favorable and it provides the perfect cover, obviously considered when we first considered this Friday/Saturday.
The second half of a Crazy Ivan shakeout (shaking out both sides of the IWM's range) occurs > $118, although price can move higher, it serves no purpose as a head fake move unless $118 is hit as the minimum upside target, from there we'll watch for HYG distribution and in the averages and can add additional short sales at that time.
Although I'd love to trade any additional gains as we foresaw this 5 days in advance, I won't risk the bigger picture and larger trend gains now and that remains firmly planted in the longer term charts such as...


TF 4 hour.
I don't have any idea what the F_O_M_C might say or do, but a new economic forecast is expected this release as well as the removal of the "Considerable Time" language, if it is left in, it will be seen as dovish and the market will knee jerk higher, if it is removed, then the F_E_D is preparing the market for the start of rising rates.
There will also be a press conference after in which Yellen can contradict anything in the F_O_M_C statement- 30 mins.


No comments:
Post a Comment