Tomorrow's Friday so in addition to the usual op-ex pin in place until about 2 p.m., we also get some of the best 3C data for the following week, like last Friday's The Week Ahead, " Looking at the 3C charts in to the close in both the averages and futures, my feeling is the head fake move above $1900 which was resistance of the 3 month range and the area we expected a head fake move which in my opinion is more than large enough to do what they are intended to do, will start being resolved to the downside next week, it looks from the 3C charts going in to the close that this will likely start early next week" Transports are down -2.8% since Friday's close and saw the worst day in 4 months today, down -1.93%
IYT/Transports which put in a Doji Star reversal on 6/9 at the top (yellow box), the same day I posted, Transports / IYT Are Looking Horribleand Transports / IYT (both on 6/9), which said, "the daily candle for IYT is looking like a bearish Shooting Star thus far, volume is already above Friday's which is something that tends to increase the likelihood of a reversal candle being effective...I think IYT is in a very interesting spot to consider it. If you are a bit more cautious, maybe see if there's a bearish confirmation candle tomorrow, I think there's plenty of downside and this would be an excellent entry area even if you have to wait on a confirmation candle of today's possible/likely bearish reversal candle." 6/9 was the absolute top, but if you are still interested, I think we'll get a second chance after today's high volume candle. As for the SPX, since the head fake move started, measuring from the close of Friday to the next Friday, the first week above the 3-month range and 1900 (both psychological buy levels for retail/dumb money) saw a gain of 1.21% and the next week, as mentioned regarding the increased ROC of price, was up 1,34%, so far this week we have a significant change of character and they lead to changes in trends with a loss of -.99%, we just needed the reversal process as the distribution/head fake move was there.
Accumulation at the February lows for the February rally, which turned in to a 3 month range, the move above the range and SPX 1900 saw severe distribution, confirming our head fake. Last Friday's 3C information gave us a high probability of this move being resolved to the down side and we have the F_O_M_C next Wednesday, I have a feeling they'll pull out a hawkish surprise the market won't like. As for the market, the earlier bounce attempt was run over, but I think we do get one, if not early tomorrow, perhaps toward the afternoon, we'll see if it's worth trading, here are some of the closing 3C charts for the major averages.
SPY 1 min positive intraday divergence.
The 2 min is what was missing, toward the close it started going positive, I don't think this is enough for any move worth even day trading, but it may give us something to work with tomorrow.
However, while those small divergences were put together near the end of the day, look at the additional amount of distribution today, we are now leading negative at a new low, 3C is forecasting a major price decline, there are a few assets that need a few days to look like fantastic entries, I'll show you one at the bottom.
The Q's confirmed price action intraday.
The 3 min chart put in a positive the last 2 hours of the day, but still in the intraday timeframes and still needing some work, we had stronger divergences than this run over today.
The QQQ 5 min suggests a bounce which works perfectly for the trade I have in mind.
However, on an institutional timeframe of 10 mins, this is how much distribution was added today alone (from the red trendline).
And the QQQ 60 min since the February rally, this is the worst distribution we have seen and almost all of it at the head fake area.
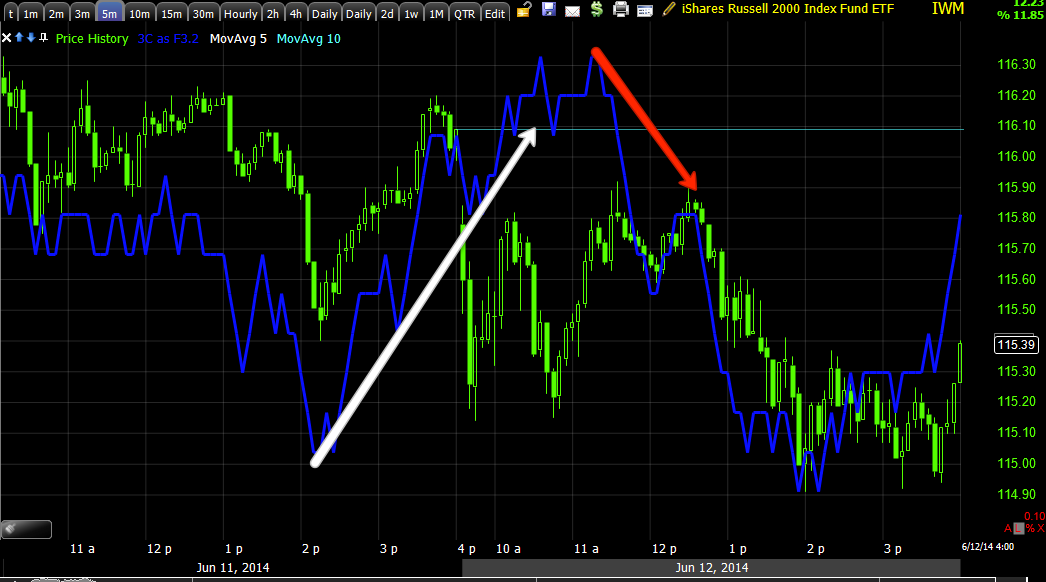
IWM 1 min has a minor positive, but a 5 min positive was run over here today, that's indicative of panic-like selling.
IWM 2 min showed price trend/3C confirmation on the downside, so it was a solid negative day.
And the 5 min positive that was run over.
Meanwhile the long term 60 min is in leading negative position. Another issue for a bounce tomorrow is the Dominant Price/Volume Relationship which was more than half of the component stocks of all the major averages, it was Price Down/ Volume Down, which is the dominant theme during a bear market, but has no next day short term implications, had it been Price Down/Volume Up, like Transports, the next day almost always closes higher. Leading Indicators indicate a bounce is likely, this is probably why GLD, GDX and NUGT which tend to have inverse relationships, looked close to a pullback, although I decided to wait until tomorrow on the NUGT long before deciding, which fits with the broad market.
HYG, High Yield Corporate Credit (a market manipulation lever) is leading the SPX a bit so a bounce to that area would not be surprising over the next day or so, however...
HYG's obvious distribution isn't going to allow it to support or manipulate the market for long, you see what happened on the last leading negative divegrence to the left, we have a worse one right now,
The VIX is leading the SPX's correlation (SPX price is inverted/green so you can see the correlation), this is a trend that was clear last week with VIX futures accumulation, now all the way out to the 60 min charts.
One of our sentiment indicators is forecasting a short term bounce, the other...
is in line with price /SPX.
As shown in this morning's , Futures Update the probabilities on the 3C charts were for the 5, 10 and 30 year Treasury futures to rally, as you can see, the 5 year did as yields dropped and the SPX followed along as is the correlation. Also as you saw later in the day, our TBT short (2x TLT long) trade, TLT Long / TBT Short Position Update, also rallied and the trade is in excellent position, if we get a little pullback I'll look for the entry on the intraday 3C charts.
Commods were up on Oil (Iraq), Gold and Silver, I have a feeling GLD will pull back, thus the add to on the GLD puts today, Closing 1 GLD Put, adding to another. As far as the trade that fits with a bounce in the QQQ, AAPL is one I've been watching for a little while, it hasn't been quite ready,, but I think this is going to be our favorite kind of trade, the one that comes to us...
This is what I was waiting for, the 60 min chart to lead negative, it finally migrated out from the 15 min chart.
Here's the 30 min leading negative
And that strong 15 min chart I've been watching, while waiting to see if the distribution reached the 30/60 min levels.
Intraday the 5 min confirmed, but short term, much like the averages...
The 2 min below and 1 min above are both starting to lead for an intraday move, we just need to get the bounce and look for intraday distribution since the strategic institutional charts are already there, this should make a beautiful set up.
AAPL 2 min positive starting to form, we may even have a decent call trade. If anything pops up overnight I'll let you know, but so far so good, we just need to keep filling out those positions as they become available, PCLN, AAPL, IYT, really I have a good 400+ on the watchlist with sell/short signals.
Many of the charts you see here at WOWS are my proprietary indicator 3C which reveals underlying institutional money movements and often contradicts price. To understand the annotations made on charts, you must first understand that 3C has no numerical value, it is a pure divergence indicator. Positive divergences represent accumulation by smart money, negative divergences represent distribution by smart money and when 3C trades with price, that is trend confirmation.
The chart annotation system is simple; white arrows represent relative positive divergences, red arrows represent relative negative divergences and green arrows represent trend confirmation. When 3C is in a white or red box, that represents a leading positive or negative divergence, leading divergences are the most powerful.
We analyse 3C in multiple timeframes, the longer the timeframe the stronger the accumulation. 1-2 min timeframes represent intraday moves, a 5 min timeframe can represent a day or two and 15 min timeframes average trends of a swing trade nature. 30 and 60 min charts can move the market for a month or more and daily charts can be over a year.
You'll get use to seeing the charts and understanding how the multiple timeframe analysis works and works well.
Welcome to Wolf on Wall Street.
The trades featured here are meant to maximize returns with the least risk and highest probabilities. Unless otherwise mentioned, all trades are meant to be executed at market. I prefer long-term trending trades which perform well in rising markets, but really stand out in declining markets. However, we get occasional one day gifts 30,40,60% 1-day gains. I'd urge you to consider taking some or all off the table in such cases, the markets don't give gifts like that often or for very long. Most of the returns that make the system outperform so well come in short-entry trades. If you are opposed to short trades, this is not the system for you, unless you are ok with buying an inverse ETF. If you would like more information about the truth about shorting stocks, just email me.
Risk management. I recommend a specific and consistent risk management approach to all positions. In most cases we try for 2% risk money (2% of portfolio) unless such a position size exceeds 15-20% of overall portfolio in actual position size. Each trader is different and each has a different allowance of open trades. I like to keep the overall money in the trade around 10-15% of portfolio per position in case of gaps against you. Stops are generally executed at the end of day and I personally never place a stop order, all my stops are mental; remember, the middle man gets to see everyone's cards. When you are not in tune with the market or opportunities just aren't that spectacular, I take my risk per position down to 1% or even half a percent of portfolio value.
Each trader is different and must determine their own level of comfort with risk. I do have a channel stop which I provide to TeleChart/StockFinder users for automated stops, I appreciate you using my links to sign up if you do. The Trend Channel catches trends and works well as it automatically adjusts for each stock's volatility. Arbitrary exits based on nervousness about the markets WILL decrease the portfolio performance dramatically. This system will not ever get you in at market bottoms or tops. The recent 1 year performance against the Russell 2k buy and hold had the system beating it by 3:1. Ultimately it is up to you as to how you proceed, but I'm always available to help you determine what might work best for you.
I do use other scans and systems when market conditions warrant their use and may change strategy with market conditions.
The MOST IMPORTANT tool you have to bring you long term success is RISK MANAGEMENT. There are plenty of articles linked at Trade-Guild.net on Risk Management. We can be wrong 75% of the time and still outperform the market with solid, consistent risk management.
Position Sizing
The position sizes noted in the positions @ 2% risk of portfolio are based on a $20,000 portfolio-adjust as needed. Due to tight stops, there is the possibility, even probability that one position could take up the entire portfolio. You need to decide how many positions you want to trade and reduce the position size according to that. For instance, if you want to trade 5 positions in a $20,000 portfolio, no one position should be valued at more than $4,000-not risk money or 2% rule, but share price entry x shares.
Is interest rates about to start going up?
-
Yes, I know - it does not make any sense - FED is about to cut
rates...but....real world interest rates are not always what FED wants it
to be.
Futures Update BR-EXIT Edition
-
So the conventional wisdom couldn't have been more wrong. Those chasing
risk and closing hedges couldn't be in a worse place right now. I would
still remin...
This website may include stock and market analysis. Any opinions, ideas, views and statements expressed here are opinion only, subject to change without notice and for informational purposes only. Trading stocks carries a high degree of risk. It is possible that an investor may lose part or all of their investment. Accuracy and timeliness of any information is not guaranteed and should only be used as a starting point for doing independent additional research allowing the investors to come to his or her own opinion. Nothing on this blog is to be considered a buy, hold or sell recommendation. *Wolf on Wall Street portfolios are PAPER TRADED, no real money is used. Any investments, trades and/or speculations made in light of the opinions, ideas, and/or forecasts expressed or implied herein are committed solely at your own risk, financial or otherwise. Results are dependent on market conditions, timing and trading style. Comments posted on Disqus Threads are not moderated and are not representative of opinions of authors of this site.
Translation: You are responsible for your own investment decisions. Not anyone else. YOU.
Position disclaimer: Authors might OR might not have position/interest in securities mentioned on this site!
Affiliations:
Authors of this blog might receive commissions and other considerations from:
Correspondents' emails are strictly confidential. The third-party advertising placed by ad networks may collect information for ad targeting. Links for commercial sites are paid advertisements. Blog links on the site are posted at my discretion, without compensation of any kind.


No comments:
Post a Comment