After a 2 year tease, "Whatever it takes"...Mario Draghi 2012; the ECB has launched its article 123 contradicting "Expanded Asset Purchase" program building on the purchase program already in place of ABS and covered bonds.
The $60 bn a month was a little higher than consensus for a monthly figure, the total at 16 months of 1.1 trn Euros was below the aggressive whisper number of 1 trn a year. Perhaps one of the biggest mistakes the ECB made was to make the program limited to 16 months rather than open-ended, of course they can do whatever they want in 16 months, but it seems the market prefers open-ended.
There have been a lot of knee jerk moves this morning, surprisingly, not as volatile as one might have expected, but this was the longest QE tease in modern Central banking. Some knee jerk moves don't look as likely to stick as others.
Stocks are certainly not looking like today is anything special and as far as "sell the strength, other than premarket knee jerks, we haven't really had a chance to see much of what the market will do as today doesn't look much different than any other normal day.
EU Peripheral bond spreads such as Spain and Italy are seeing elevated risk spreads.
As to the charts, the futures charts around the announcement look a little more impressive than the actual cash market charts.
ES knee jerking higher and then giving up all QE gains...
EUR/USD lower as would be expected.
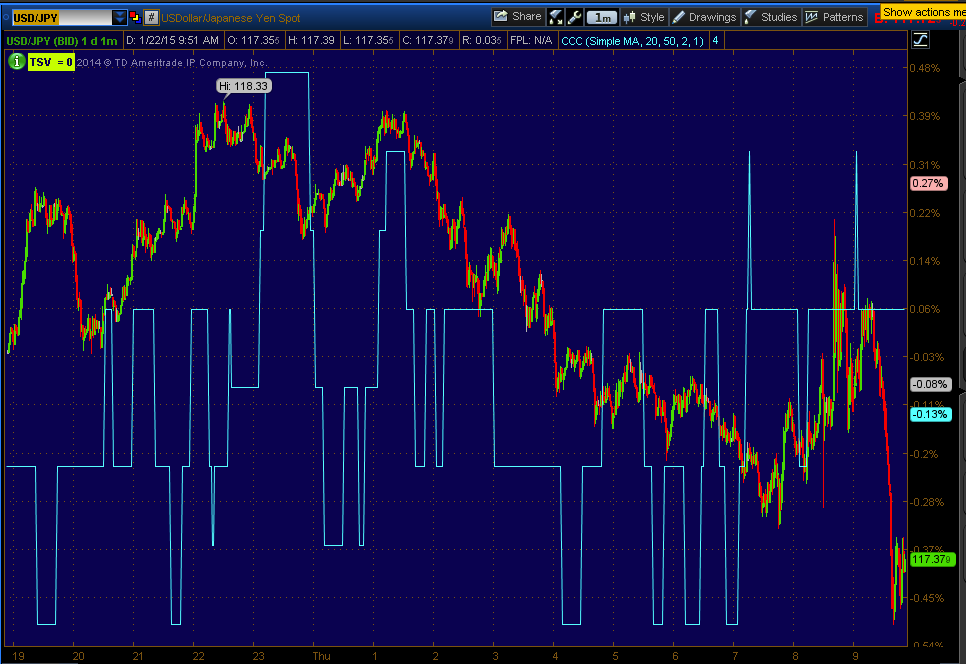
USD/JPY also taking a hit. I suspect the pair will find some footing soon and possibly reverse to the upside shortly.
Crude's initial pump and then dump, however I think USO near term expectations are still on track.
Gold's initial pop higher, but I think near term GLD expectations are still on track.
30 year treasury futures...
This is the intraday 1 m GLD chart, so far it looks a lot like yesterday's smack down of the gap up, one of the reasons I suspect near term GLD expectations (pullback) are still on track.
The USO chart , despite pre-market volatility , didn't move below the range and it's larger divergence for a move higher is still very much intact.
SPY 1 min fading the opening gap on an intraday opening negative divergence.
The 3m base chart/divergence is still intact.
QQQ, but all of this action was from yesterday.
including the 2 min chart. The question for the very near term is whether charts like this get worse in to some price strength and migrate to longer charts showing the bounce phase is coming to an end.
IWM 1 min is a mess, nothing really to see here.
However the 2 min has a trend, it's from before today as of now.
And its 3 min base is still intact for the time being.
TICK as you see hasn't made any spectacular moves this morning,
again, it looks like an average day as if nothing happened so far.


No comments:
Post a Comment