I think the charts speak the best to the subject...
The daily chart of Transports with a clean stage 2 trend (Mark-up) through 2013 and most of 2014 sees a Channel Buster. You may recall several stocks we have traded on this set-up, typically a break to the upside followed by a downside break. This is the opposite, first a break to the downside and then a break above the upside of the channel, it's really the same concept as a head fake move, stops, momentum, etc. However while the Channel Buster is certainly a red flag warning, what is really standing out...
Is the very clear change in character which inevitably leads to changes in trends. The uptrend is clean, but on falling volume until the Channel Buster business, after that, what do you see that has significantly changed in IYT's character other than volume? A choppy range and one that's quite a bit larger than your typical consolidation, any way consolidations aren't known for increasing volume, tops and churning are.
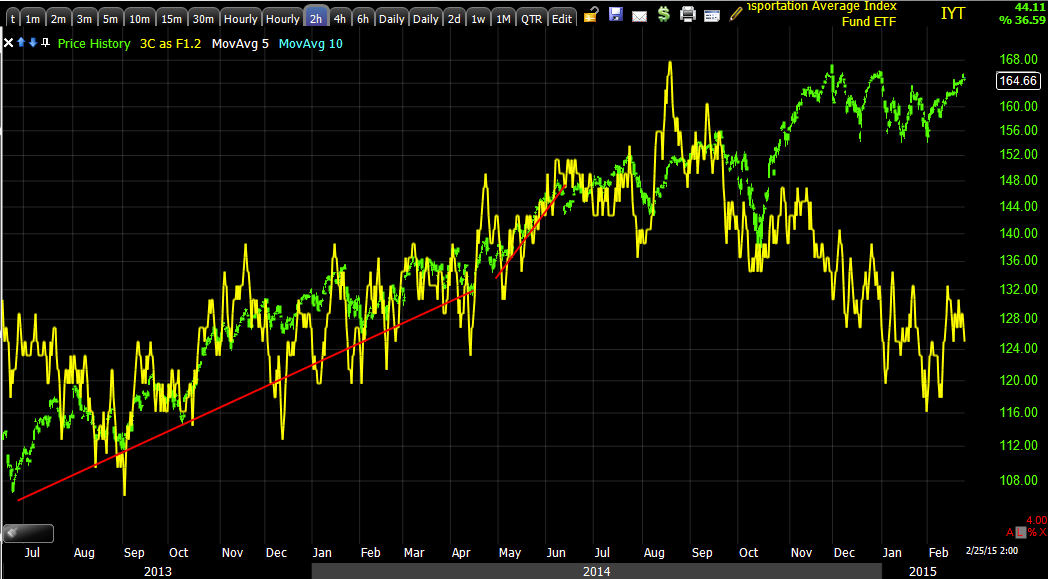
This 2 hour 3C chart tells me all I need to know to confirm the 2 charts above. The chart goes from upside confirmation to, well I think you can see the divergence quite clearly as it is unrelenting and significant in size and timeframe.
The 60 min chart which I can't quite properly scale as 3C should be lower along the uptrend with price, is also confirming the exact same and is where we first saw signs of trouble in transports.
As to smaller cycles, this is the most recent which is also clearly negative, 3C distribution in to higher prices, which are really just part of a large zone of chop.
The more recent timing charts like this 3 min are clearly deteriorating. In other words, as I said above, if I had room to add, I would, otherwise, I have no problem holding an asset like this short as a longer term trending trade.


No comments:
Post a Comment