Last night's internals seemed to add additional evidence to what was more of an experience call than a strong objective evidence call, that seems to be starting to fill in today.
A bounce in this area makes perfect sense, especially before the F_O_M_C next week where it's widely expected or suspected that the F_E_D will remove the term "Patient" and pave the way for a June rate hike being the Non-Farm payrolls were the last payroll data before the meeting and they were strong , at least on the face of it when you don't look at the U6 number or don't account for the shrinking work force.

The Q's and IWM perhaps finding support at the 50-day would just bolster the case for a bounce in the mind of technical traders and since that's what everyone is these days and they are so easy to predict, it's kind of like picking change up off the street for the market.
In any case, this morning it looks like we are seeing a bit more of a rounding bottom, which means it may be a bit of a bigger, more supportive area to bounce from, possibly in to the F_O_M_C next week, although I don't have what I would call objective evidence at this point that would support that possibility, it's just an experienced guess as it looks more and more like "Patient" will be removed from the March meeting's policy statement as per none other than the Richmond F_E_D's, Lacker (voting member) who gave an interview on Sirius satellite radio network yesterday looking for exactly that, removing patient in March, clearing the way for a June rate hike (both his words, not mine, but this is what we have expected recently).
Last night in the Daily Wrap I made a case for a short term oversold condition. I want to be clear, this is not the same "Oversold" condition that many of you are use to seeing on charts with indicators like RSI or Stochastics as they peg the lower bounds of their range (below 20 or 25), this is a shorter oversold condition and not based on indicators that can stay oversold for a long time. In fact, one of my best performing (back-tested) trading systems only bought overbought stocks and only shorted oversold stocks as they can stay that way for a long time and it worked very well out of hundreds of systems tested.
This oversold is based on the Dominant Price/Volume relationship and sector/Industry group performance, it's based on breadth and as such is shorter term in nature.
As for additional evidence building, you probably know which asset I usually look at first for an early head's up warning, HY Credit which I'll get to.


But first, HYG...

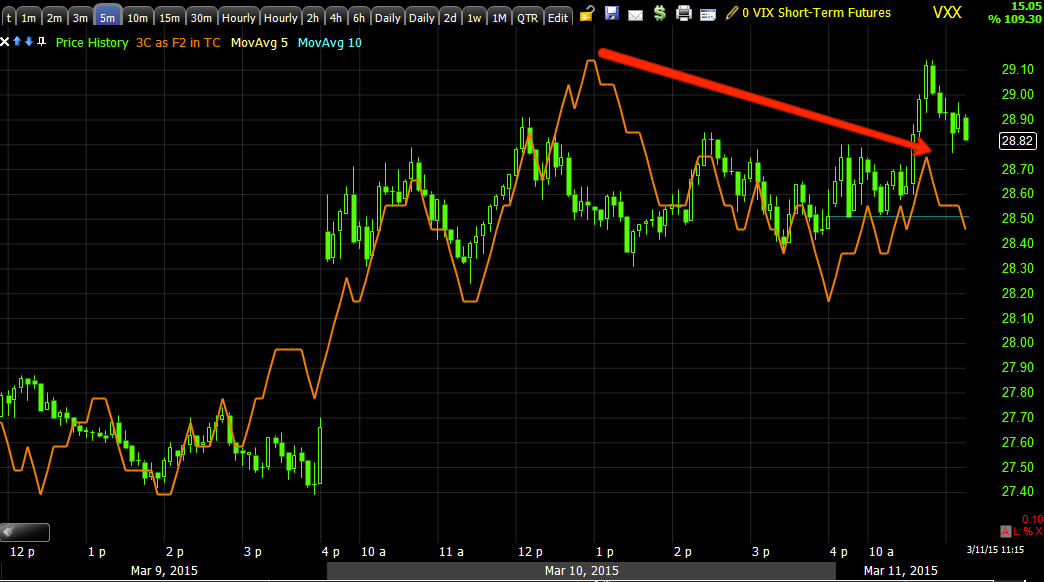
There's not much of a 3C divergence , but for HYG, it's the price divergence that matters or support, this is the first positive move since the break to the downside.
Note the change in the ROC of price as it ends with a near parabolic dump, short term capitulation as almost every cycle or transition point will have, thus ROC is a great indicator to watch on price or to make your other indicators more sensitive.
In other words, we have more evidence of a bounce coming, short term, it's still nothing I want to buy, but rather use it to short/sell in to.
That's the information we're gathering now.
Typically, a counter trend bounce has one objective, it is to sway sentiment.
If you are a bull (hypothetically) and you've just seen NASDAQ 5000 fail and the Dow 600 points lower since, you aren't feeling as confident, maybe you are even thinking about becoming a bear, this is what Wall St. is trying to head off, thus a bounce usually has to be convincing enough to get the bulls feeling good again about their positions, lock them in place and continue the dump. However there area lot of dynamics in play, especially with the F_O_M_C next week.
My gut feel is that they'll try to bounce the market in to the F_O_M_C which means maybe today to finish up a base, tomorrow to get a bounce underway , Friday is a wasted day for the most part with op-ex pins although last Friday wasn't and the meeting starts Tuesday and ends Wednesday with the policy statement at 2 pm.
I could be wrong about the size and timing, we're still gathering information that is just now coming in, but that is what I'd normally expect. Again, I don't have the objective data yet to back up such suggestions and if it doesn't materialize or if it is something different, then we'll make projections based on that, I'm just speaking from a hypothetical, "What would I do if I'm thinking like a crook?"
I'll have additional asset updates and it's probably a good time to look at trade set up ideas.
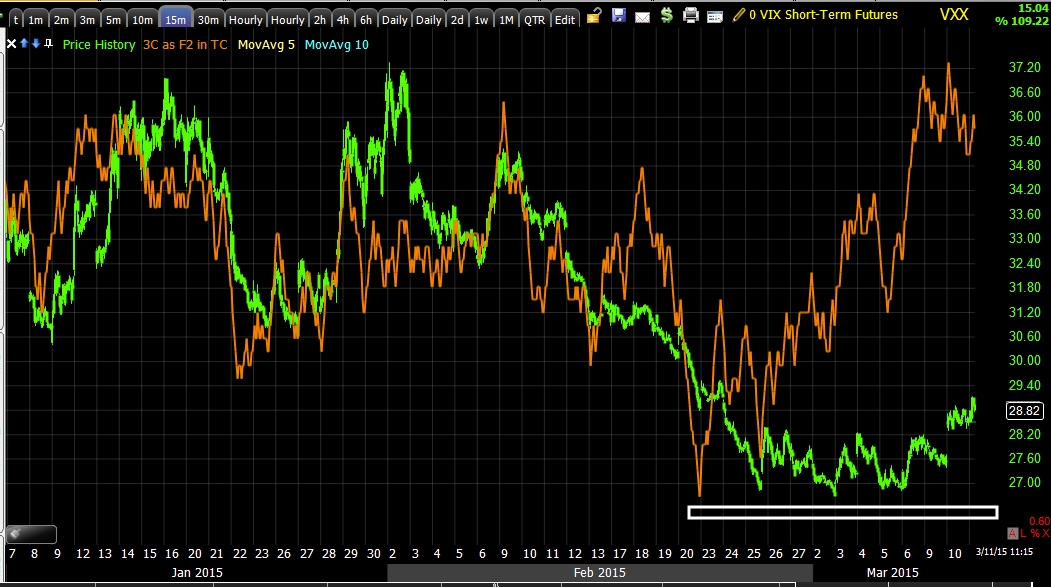
In no way whatsoever am I concerned with core short positions and the resumption of stage 4 breaking below the 2015 range and challenging the October lows for a new lower low, at which point, the entire technical / trend classification has changed and the market is officially and unambiguously in a very bearish Dow theory trend classification that historically doesn't end well for the market.


No comments:
Post a Comment