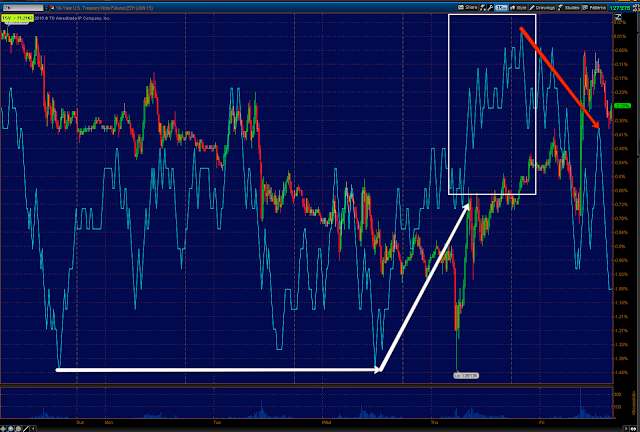
Treasuries have to be one of the thickest short positions right now, thus primed for a short squeeze as their decline recently has been near record setting.
This is not the reason we entered the TLT long (meant to be an options trade/Calls, but I couldn't get the tracking portfolio to recognize the ticker for the position so I used TBT short instead to create a 2x long TLT position), Trade Idea: Long Bonds / TLT
I said very specifically in the post above,
"I'm going with a half size position in TLT (20+ year Treasury Bond Fund) June 19th (monthly) CALLS with a strike of $122. If TLT pulls back a little, I'll add the second half of the position."
Then I posted the charts here, Bond Rally / Swing.
To be clear, I see this much as I see the $USD trade, a Counter-Trend swing, but counter trend moves in a bear market (which both are either in or moving toward, are SOME OF THE SHARPEST RALLIES YOU'LL SEE. Just look at the first rally after the initial Dow 1929 crash, it was nearly 6 months and was good for a +50% gain without any leverage.
This is because a counter trend rally must be strong enough to overcome the presumption that bonds are in a bear market, which means the emotional component of touching on the "Greed", "I don't want to be left behind" is essential. The initial short squeeze provides a good deal of the upside momentum initially and after that traders start to wonder if "maybe" the rout in bonds is over and they are worth investigating as a long position. This is not specific to bond, THIS IS THE BASIS OF WHY BEAR MARKET COUNTER TREND RALLIES ARE THE STRONGEST RALLIES YOU'LL SEE AND WHY I'VE DECIDED TO PUT TLT (20+ year Treasury/bond fund) out there as a long swing trade.
Today as expected, TLT was up, but also as expected as I left room to add on a pullback, it looks like we will get that pullback.
Here are the charts via TLT and Treasury Index Futures...
TLT intraday 1 min in the green on a gap up as expected not only because of the charts, but on a surprise in the Payrolls data this morning. I SUSPECT THERE WAS A LEAK.
This tells us that a near term pullback is likely even though the position entered yesterday went green today. I left room specifically to add based on expectations we'd see a pullback as the chart above indicates.
The 3 min TLT chart is a bit more clear with less noise, showing both the near term positive (larger) and the very near term intraday negative (smaller) today.
The 5 min 30 year Treasury futures show the same thing...
5 min 30 year Treasury FUTURES showing an inline or price trend confirmation signal in 3C at the green arrow/downtrend in Treasuries.
Then the positive divergence and the pullback expected since yesterday near term which will build a slightly larger base "W" probably, to support the upside move. Small or sharp "V" bases are just like the foundation of a skyscraper, if your foundation is not strong, what you build upon that will be subject to the weakest link which in this case is the base or foundation, thus it needs to be widened out which is why I only entered a half size position yesterday.
The longer 10 min chart however shows the positive divergence that has accrued on the longer term charts and is telling us a counter trend rally/bounce is highly likely.
The 5 min TLT chart tells us the same. The green line is the minimum price target based on where the divergence first started, however we usually suprpass that target by multiples.
And the longer/stronger TLT 30 min chart with distribution leading to the downtrend and now a leading positive divergence, not as big as the distribution so I suspect we get a strong counter trend bounce/rally, but at the end of the day...Bonds go on to make a new lower low which we should catch as another trade when the time is right.
Is interest rates about to start going up?
-
Yes, I know - it does not make any sense - FED is about to cut
rates...but....real world interest rates are not always what FED wants it
to be.
6 years ago


No comments:
Post a Comment