Leading Indicators look pretty much as I expected, although I was again a little surprised that to pull off a bounce
(which is nothing unusual even for stage 4 decline as there are about as many up-days in a full-blown bear market as there are down days) they are pulling out all of the tricks to some small degree, the last one I just posted while I was going through Leading Indicators was the typical end of day Whack-a-VIX which we usually see when a market is borderline closing red/green, it gives that extra little boost to try to make it green.
I'll just put them in the usual order...
This is the SPX:RUT ratio, which is based on the concept that the R2K should lead any rally. If you recall the days of the Great Bernanke's congressional testimony, when referencing the market he never used the household Dow Industrials or even the S&P-500 as a point of reference for his QE/Wealth effect which is some central bank distortion of "Tickle Down Economics". In any case, her correctly recognized that the R2K should lead any risk on event and that's why he always referenced the little known R2K (not a household name among non-traders) as his audience was the retail that were buying the bubble he was blowing.
In any case, the indicator is slightly positive as it should be wit the R2K outperforming relative to the other averages on the day.
Pro Sentiment predictably is not buying in to this as they sold in to the bounce off July 10th.
Here's a wider view of the same indication through the bounce.
And here's the same since the SPX's May head fake when the indicator first went negative and remained so until the base for the July 10th bounce.
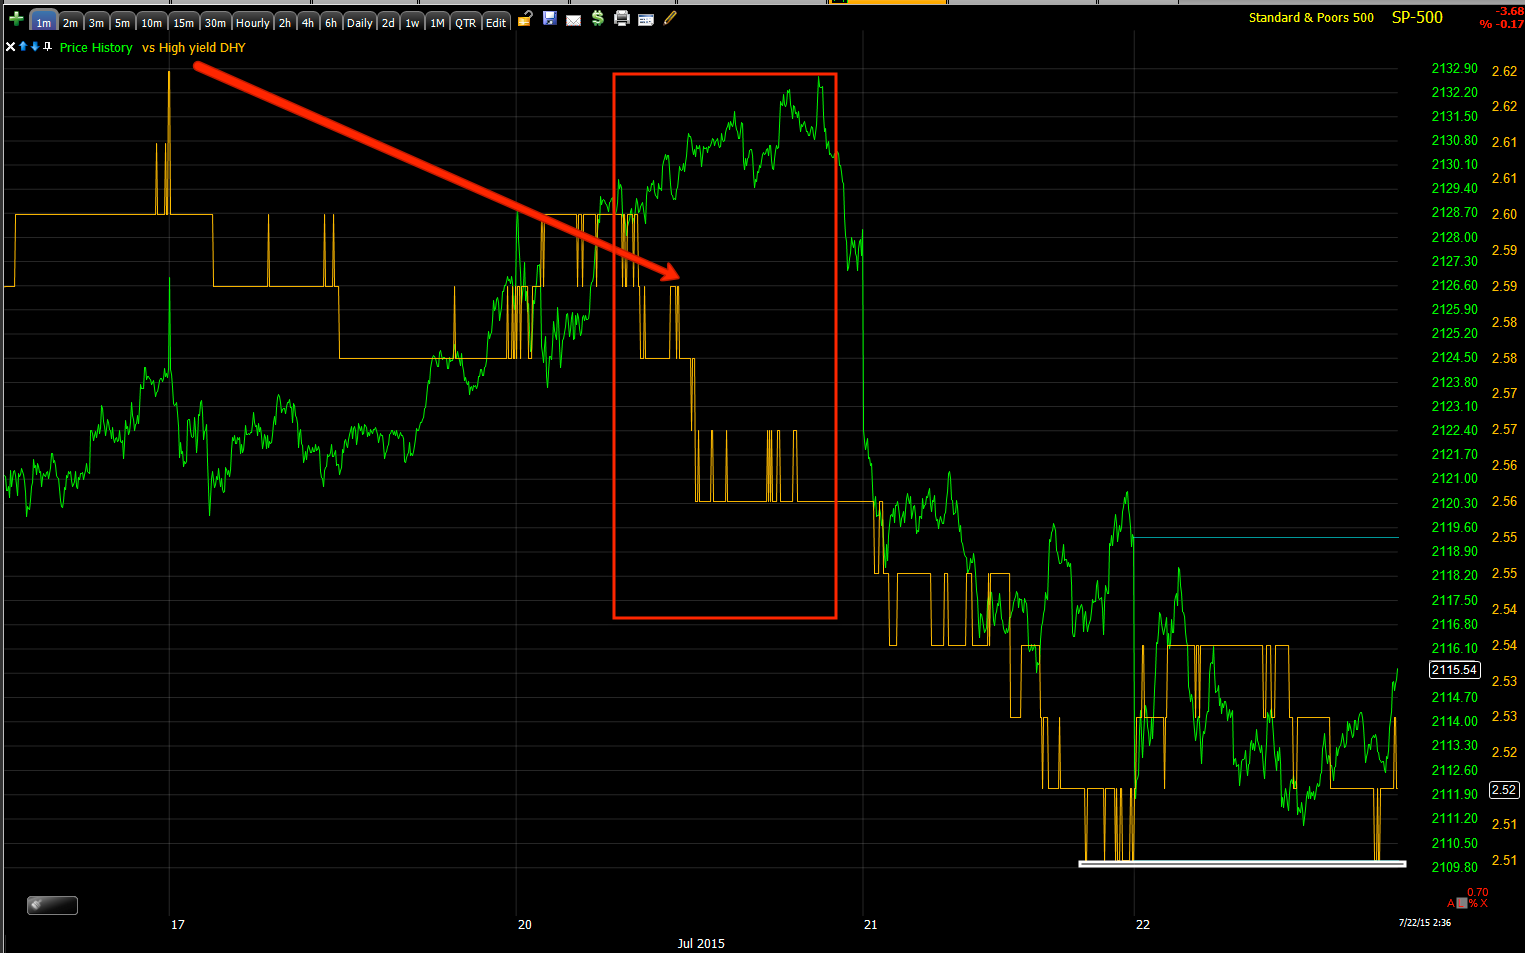
HYG is more or less in line, I showed the earlier 1 min positive divergence, but so far it's not leading the market.
As for HYG through the bounce cycle until now, you can see where it fell off leading the market to the downside,
This is the VIX slam I mentioned this afternoon, SPX prices are inverted so VIX should be at the same level, but it was apparently slammed lower which helps support the market.
The same occurred in VXX as well for the same reason.
As for 30 year yields, I addressed them earlier today, they are more or less in line intraday.
On the scale of the recent bounce, this is what yields look like, again a much more negative longer term perspective.
HY credit is in line intraday, but again putting the indication in context is important.
HY credit since this bounce began leading lower.
They are trying to hold the market together here for a bounce, whether gap fill or op-ex I don't know, but we saw this yesterday as well.


No comments:
Post a Comment