The P/L looks like this...
With a full size position inclusive of the first trade alert and second add-to alert 2-days later, the average cost is $44.70 for the short position, the fill on the just closed position is $31.69 for a P/L gain of +41%, I have to say, I think that's darn good for this particular play after already having taken the VXX puts off the table earlier this week for an additional gain of +49%, VIX / VXX /UVXY VIX Futures Update

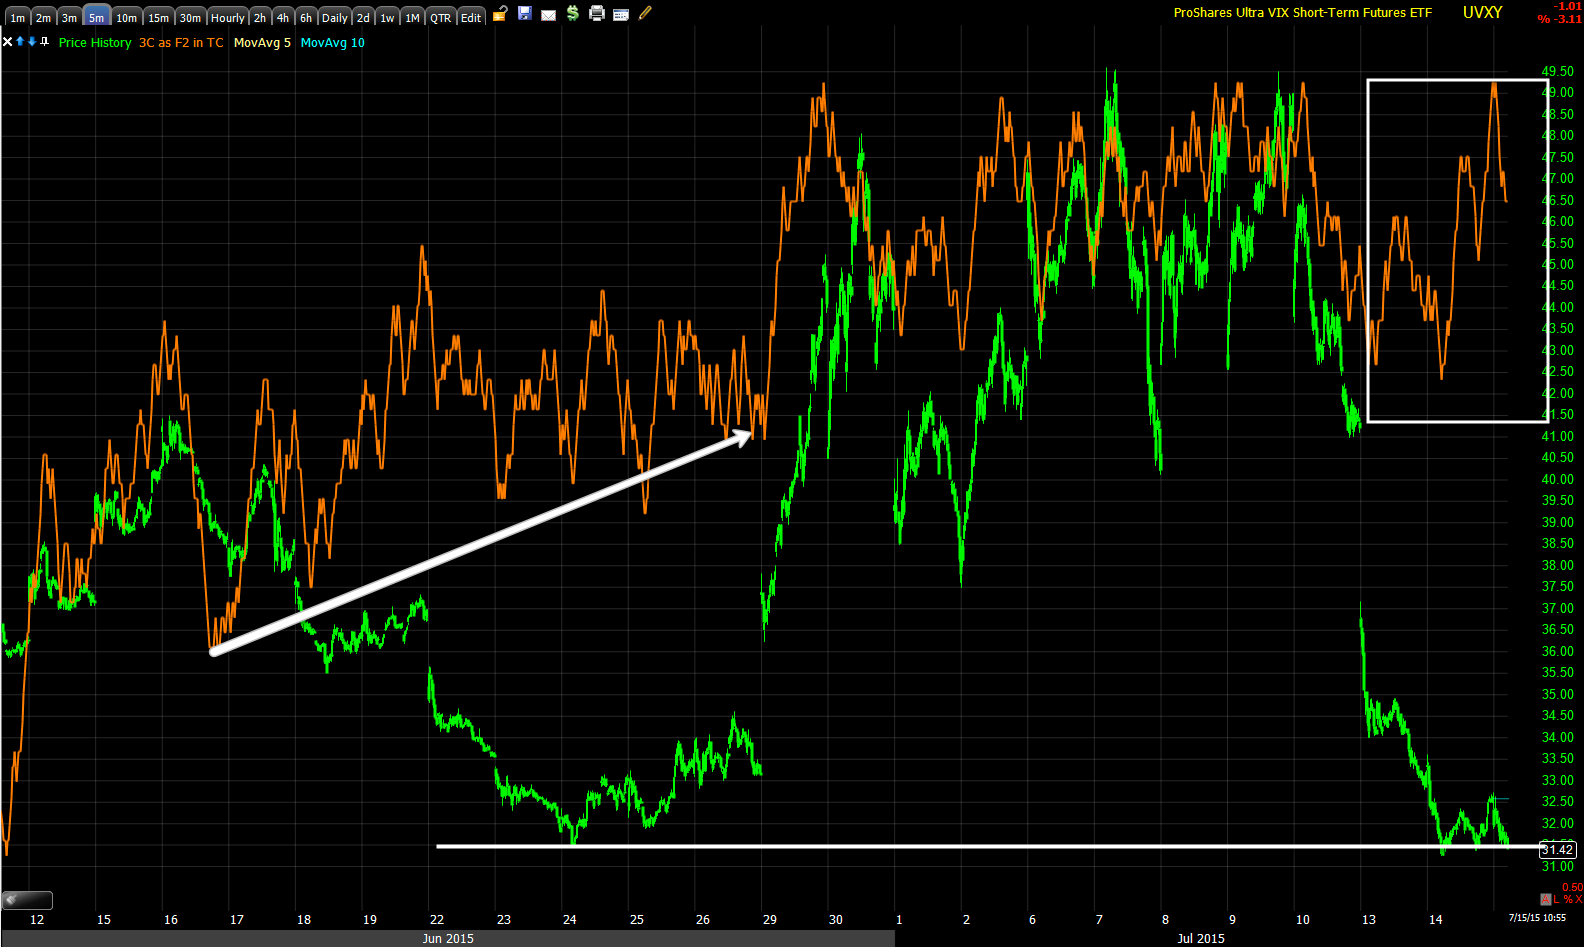
Quite often when we are seeing a double base form, the second half or low of what would be the second low of a "W" pattern, often has a stronger divergence than the first half. My point is, I don't believe the current base that is forming to the right is the entire base, I think it is merely the second half of a much larger "W" base and the distribution/negative divergence at the top would suggest the same, a pullback, but not a total wiping clean of the position.
In all of this you have to keep in mind that institutional position sizes are very different from our position sizes. Many of you may remember the charts of home builders being accumulated as the Tech bubble popped in 2000. It was not only interesting that after the Tech revolution and Internet that changed the entire world home builders would be accumulated, but that they would be accumulated a couple of years in advance of the housing boom that would support the next bull market. Who would have thought housing would lead the next bull market after such an amazing Tech revolution and how did smart money know years in advance of the actual inflation in housing prices which in my area were double and even triple over a 4 year period?
The larger point however being, those charts I showed you showed a year and a half of accumulation, I mention this to highlight the difference between a retail position that is filled in one order and an institutional position that can take quarters and even a year or more to fill out.

If such a base were under construction and nearly finished, then our forecast of the SPX/Market breaking down hard and the SPX slicing through its 200-day moving average the same way it sliced through its 150-day moving average when it bounced off it would seem to be very accurate.
As I have said, we have made a series of lower highs and lower lows since the April 2nd forecast of a head fake/false breakout leading to a move to the downside and that occurred in May as we have seen in numerous 3C charts and Leading Indicators.

At #1 we have the May false or failed head fake breakout above the triangle as we saw in numerous averages and assets at the same time. At #2 we had support as forecast (speed bumps) at the 150-dma in purple with a bounce forming a lower high at #3 and a slice right through the 150-day at #4 with the head fake/stop run below the 200-day moving average in blue at #5 as expected and a bounce off that which would have to at least cross above the yellow 50-day moving average as it has done now at #6. We could see another lower high made with a downside reversal in the area, but even if we don't get that new lower high, I have little doubt that price fails and slices through the 200-day as it did the 150-day, but this time being the 200-day is one of the most watched moving averages and the SPX one of the most watched market averages in the world, I suspect the downtrend since May will take on a whole new character with fear taking over and larger downside moves.
This would explain the larger VXX/UVXY base and volume in the area as well as price action itself and its ROC to a lateral stage 1-like base.
I'll be entering a VXX based position soon, as usual, I'll always post the idea before entering it in our tracking portfolio.


No comments:
Post a Comment