Friday, December 10, 2010

Eyes on China/Europe

China and Europe Dominate the sentiment driven market.

Today's jobless clams were another farce as again, last week's numbers were as usual, revised higher. There's n point in discounting current releases until a week later when they are revised, it's almost always higher. It makes one wonder at what point we'll see this in american cities?


In England protests turned violent, even turning on Prince Charles, shattering the glass of his motorcade. And this is over a hike in tuition fees for students. Here at home unemployment benefit are running out, unemployment is headed higher, home prices lower, home loans higher and inflation-real inflation (not the number we always get which is “excluding the things we use every day like gas and food”) is much higher.

The Irish bailout situation is threatening to tear the eurozone apart as key players like Germany say “Nein” to creating new facilitis to handle the bailouts that are coming. Interestingly, just about every Eropean country most likely wishes that they ddn't sign onto the Euro, although for totally different reasons.

As I mentioned last night, financials held the market in it's dead-man sone of resistance with good head start gaps being faded, the Dow toda closed down for a loss, the momentum in the NASDAQ was cut in half and the financially heavy S&P closed about the same as the XLF or financials kept it afloat. As I mentioned last night, there were plenty of financials set for follow through today and it would take a few days to unwind those positions, but he gains were smaller, the XLF is headed into a resistance zone and showing those positions being distributed.

 XLF 5m

 XLF 30 min

XLF Bollinger Band resistance

 DIA 30 min

 DIA daily

 QQQQ daily

 QQQQ 1 min

 QQQQ 30 min

 QQQQ 60 min

 SPY 1 min

 SPY 5 min

SPY Daily

 BAC-last night I called for a stop out, today it did stop out of the trend channel

 GLD 15 min reversal point

 GLD hourly looking bad

 JPM-as I mentioned last night, the rally in financials is being unwound or distributed-you can see that in JPM today

 The Dollar looks like it's rebounding, accumulation in white-this won't be good for commodities or equities.

 UUP 15 min chart in a leading divergence today

 UUP hourly is turning up

The VIX hit 6+ month new lows today


Just for example, here are some of the biggest players on the major averages, as I showed last night, the Index performance is not a good representation of what is going on inside the indices themselves, this is accomplished by buying the right stocks or buying weighted stocks to give a appearance that isn't really accurate. While I don't expect you to sort through 500 charts, I thought I'd show you a representation of different industry groups and how they've acted the last several days-these aren't little stocks.

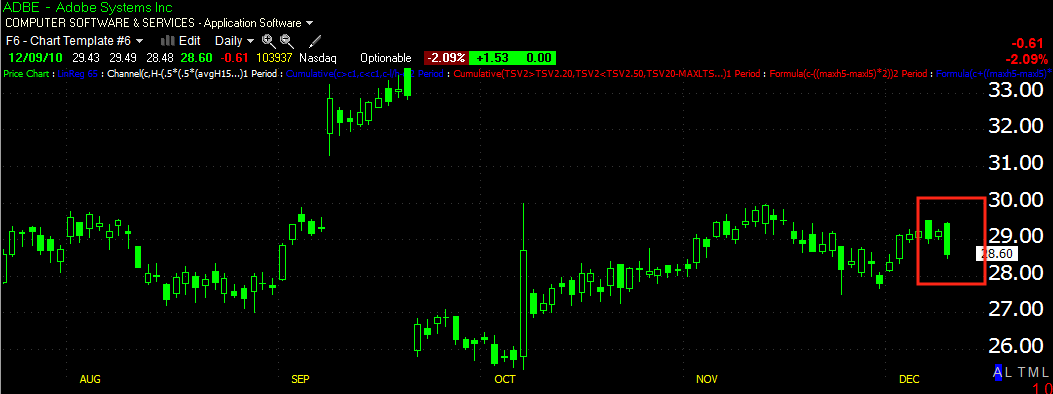
 ADBE-which has been on our short list

 AMZN not performing well in this market

 AVB-real estate-don't forget our long position in SRS below

SRS doing very well

 BA-another short idea...

 BEN-financials

 BXP-more real estate

DIS

 JNJ

 LLL

 MCD... McCafe not doing so great?

 MMM -another short idea recently

 MON-Agricultural chemicals

 NBL-energy

 NEM-mining

 SPG-Real Estate

 VNO

WMT!

Any of the above will probably make for great short ideas. This is just a small sampling, but as I said, it reflects the market of stocks. 


Thursday, December 9, 2010

SPY continues to struggle at intraday resistance

Not a lot of direction

 SPY 1 min had trouble with the earlier resistance , been showing distribution since.

The 15 min chart zoomed in is slightly better then in line, but compared to the recent past, it's still very negative.

All of the other charts I've looked at have shown basically nothing.

The only thing I see moving the market at all is some volume surges.

Going negative

 DIA 1

 QQQQ 1

SPY 1

Short term traders,

 There's a negative leading divergence, but the earlier positive divergence looks big enough to support some further gains, unless the EUR/USD trade is turning south or some other fundamentals get in the day.

Watching a 10/22 moving average on a 5 min chart can give you a good idea of where the market is headed short term. The pullback has been deep, but as long as it can bounce off the blue 22 bar moving average, and make a new high, it has a chance to add to the intraday upside.

Day Trades-short term trades

The market isn't making new lows, 3C is in a intraday positive divergence, move quick and you can probably make a quick buck on a long ETF-leveraged ETF.

Update

 DIA 15 min

 QQQQ 15 min

 SPY 1 min

SPY 15 min

Angry Europe is Back

Yesterday was relatively quiet, today the fireworks have started early-


If successful, where exactly that would leave Ireland, besides their own rhetoric insisting their government is financed through mid-2011, well who knows. If they truly do not pass this vote, I'm guessing a new deal would have to be worked out. The problem is that substantial damage will occur between now and then with Bond rates and CDS rates (the cost of borrowing and insuring those bonds) will go through the roof for the entirety of Europe. Germany is already seeing higher borrowing rates, which effectively means it will cost German CITIZENS more money to “help thy neighbor”.

Of course Merkel has already threatened to ditch the EU once, politically she may have no choice as Germans are not likely to take kindly to Ireland's obstinace, which will cost German tax payers more money both to help Ireland and to finance their own huge debt burden.

Italy has seen it's rates jump this morning. Portugal, Spain=no more lending facility.

The Euro has responded appropriately, which should put pressure on American markets.

Also in this morning's news, London Protests-


Euro Plunging-

1 min chart.


BE SURE

To check out the SPECULATIVE TRADES listed on the TRADE SHEET linked to the upper right of the site, the ones in RED were added last night, these are quick trades, many are close to triggering and ALXA I listed as a market trade, take a look and see if you like any. Any quick gains or big gains should be booked soon. You can email me about specifics.

Wrap


Today the financials took the lead and were up 1.65% compared to an average gain in the market of about .30% A quick browse through the financial charts show many starting to roll over a bit, but there were also quite a few that posted solid gains on rising volume which opens up the possibility of a follow through day, at least in the early going, unless the Euro corrects substantially overnight. There could be an opportunity in some banking names or just financial ETFs, if you are able to buy and sell the same day, as it may not last too long. It does take time to distribute the gains in some of these stocks that closed well, so I'd expect the financials to outperform tomorrow, but probably not to the same extent as today and this is why I say the opportunity may be early and fast fading into the afternoon.

The bottom line from the pundits today is that the market hasn't decided how it feels about the tax cut surprise that knocked the market down Tuesday, but suddenly the market changed it's mind on Wednesday. I have a feeling that Tuesday was a hard hit that wasn't expected combined with the bond vigilantes, which took a breather today, I believe it allowed some losses from Tuesday to be made up today.

I'm adding a couple of very speculative trades, these are not long term or even swing trades, but trades that you may realize a quick gain and should be quick to take it if it materializes, they also should not be big trades, that's why I say speculative. You'll find them on today's list on the spread sheet highlighted in red.

 BAC is one trade that has been trending well for awhile, but it's recent failure to make a lower low wold have me booking profits for now. It can always be reentered later. It hasn't hit the stop, but I just have a gut feeling on it, if you realized decent profits from the extended trend, I'd consider booking them.

As for the market, there are more then just 3C negative divergences, there are divergences in MACD, RSI and quite a few lesser known indicators I combed through tonight. Then I decided to check breadth as it's been awhile since I did and I've been maintaining the theory that despite the apparent highs in the market, there's a bit of illusion as the highs are in the indices. However, the market is not 3 averages, it's  a market of stocks and as I have been maintaining, the market of stocks is tanking while the averages give a false impression which is a good reason not to focus so much on the averages, but rather the good trades that are out there as the market of stocks is declining, despite the 3 averages.

Here's the impartial facts...

The green line is the indicator, the red line is the comparison between either all of the NYSE listed stocks or specific averages the indicator measures.

 Percent of stocks that are 1 standard deviation above their 40 day moving average-that would mean they are trending higher then their 40 day moving average by at least 1 deviation-the strong stocks. Luckily in red, the NYSE, we can measure between two almost exact same price points. In November that % of stocks was 65%-pretty strong, now it's 45%- or in other words at the same price level 20% less stocks are above that 40 day moving average by a standard deviation. Or in plain English, 20% less strong stocks now as compared to a month ago.

 Percent of stocks trading 2 standard deviations above their 40 day moving average-these are even stronger stocks that have run way above their moving averages. In November it was 45% of stocks, now half that, 22%!

 Percent of stocks just trading above their 40 day moving average, in October at lower prices it was near 90%, now 60%

 Percent of stocks trading above their longer term 200 day moving average, was 90%, now 75%

 Percent of stocks 1 standard deviation below their 200 day moving average, these are stocks that are trending down, below their long term moving average or are in bear markets. They were about 5%, very few, that number has almost tripled.

 Percent of stocks 1 channel above their 200 day moving average-lost over 10% of stocks

 Percent of stocks 2 standard deviation above their 200 day moving average went from 40% to 29%

 Percent of stocks 2 standard deviations BELOW their 200 day moving average, these are stocks in big trouble, went from about 3% to double that.

Stocks making new highs/new lows over 13 weeks period, what is interesting is the number went from 90% to 67% in ONE DAY! That would be today. The calculation is new highs-new lows, the lower the number the more stocks making new lows.

So there it is, pretty much what I've been saying. The averages portray the stock market, but these charts portray the market of stocks and in my opinion, being long right now with these kinds of numbers is like holding a hand grenade as long as you can for maximum gains and hoping you throw it before it goes off. Being short the right stocks is not trading against the trend, the trend is clearly falling apart.