Monday, January 24, 2011

Last Market Update

Last noght I mentioned oversold, which would mean a bounce which is what we got today. This does not mean strong trend/strong market. We have to see what this bounce can do and what kind of follow through we get. The end of the day is when most Wall Street transactions take place so there's an emphasis on trading near the close. Here are the SPY afternoon charts..

 The 1 min went divergent in the early afternoon and headed down by 2:30-ish. IT hasn't gained much upside traction, but is more in line right now. It's not a particularly strong close.

The daily chart shows this to be thus far just a bounce, volume is not heavy and the % gain is around half a percent. We may be seeing a triangle configuration forming which would make sense with advance GDP coming out this Friday.

More to come in a bit.

ADDING KO TO THE TRADE LIST

 KO 1 DAY 3C LEADING NEGATIVE DIVERGENCE

 30 min 3C multiple negative divergences

 A bear flag, this may see a run to break up the obvious pattern by the black box traders, that's why there will be 2 stops. Ultimately though, the flag should fail.

The first stop which is tighter and held the previous uptrend very well is $63.88, the wider stop that I'd personally use is at $64.50.

I think there's a chance of a small bounce. You could scale into the position or just add it here-I prefer to scale into it.

SPY Continues to Diverge

1 min. 3C SPY

The SPY 5 min chart is now showing the divergence as well.

Chart Request -DUG

DUG is an inverse ETF which if bought log gives you short exposure to the Oil and Gas Services industry.

The Charts...

 DUG 3C daily chart-there's a price pattern called a bullish descending wedge in the white box, the same place there's a 3C positive divergence suggesting accumulation has been ongoing into lower prices.
The divergence in June shows price making a higher high and 3C failing to confirm that high.

 The 5 min 3C chart also looks bullish. Note the different divergences both positive (white) and negative (red) and the resulting price moves. Right now the 5 min is in the strongest type of divergence and that is a leading divergence as 3C makes new highs despite the price not doing the same.

 I don't know what happened with my text box, but it's a long trade stop using the trend channel, it should say $34.40, although since there hasn't been a breakout of the wedge yet, I might consider a wider stop. The trend channel has worked well with DUG-if you initiated a short trade at the small red box, you'd still be in the trade as there have been no false stop out signals and you'd have a profit of 17-19% assuming you didn't add to the position.

You may wish to enter the trade or phase into it in this area, but the breakout of the wedge will occur around the $35.40 level and $36.40 will take out the first zone of resistance. The implied target is a bit above $44.00, although that's just the target from the wedge, it could certainly run higher.

I like the positioning in this area. A word of warning though, these wedges have been forming bases after breaking out. This one may be different as it is related more closely to commodities, it's for this reason that I'd consider a wider stop or you may want to chose the tighter stop and be able to give the trade a few shots until you get the right positioning. Pro traders will often take 4-5 shots at the same trade and then get good positioning, all while keeping losses small. Amateurs loose too much on their first shot and then walk away from a good trade.

Market Update

Like last week, the Dow seems to be tipping its hand first

 DIA 1 min-this divergence may be enough to turn the tide to the sell-side.

The QQQQ is just starting to show the same, not to the same extent. The SPY is still pretty positive, but should follow the other two averages.

Market Update

Last night I said this about the market,

"As I mentioned in my last post, there's fewer bullish looking charts right now then bearish (at least per my crossover scan-with very recent results) however, that is often a sign that the market may be overextended or oversold. We saw a very mixed market on Friday with the Dow performing the best at +.41%, the S&P at +.24% and the NASDAQ 100 which was the most dominant in terms of percentage change coming in at -.78% so the market may in fact be oversold and divergences between the 3 averages of this magnitude rarely last long."


Today, here's what 3C is looking like on the 3 major averages thus far. 


 DIA 1 minute shows a small negative divergence, there may be some loss of momentum, but it's not large enough in my opinion to create a reversal as of yet.

 The 5 min 3C chart on the DIA is confirming price's trend this morning.

 The QQQQ is showing near perfect confirmation, already up by .90% it seems last week was quite oversold.

 The 5 min Q's chart, again near perfect confirmation.

 The SPY 1 min is showing a small negative divergence, but agin, not strong enough for  full reversal yet.

The 5 min chart has good confirmation.


As of now, the averages are looking stable. There is the inherent breadth weakness as I highlighted earlier with GOOG/BIDU and others, but nothing goes straight up or down. Whether this is a move of consequence or not, we'll have to see how 3C holds these gains.

Municipal Bonds -A Theme Investment for 2011

I've highlighted MUB several times in the last month or so. MUB is an ETF covering national municipal bonds. With government aid to states set to expire mid-year and the housing crisis and demand for extended state benefits for the unemployed, the funds for state and local governments are still very under capitalized.

The recent trend in dumping municipal bonds is getting worse and the S&P rating service announced they expect to downgrade more municipalities this year. As investors pour out of these funds, the yields rise which makes repaying the debt obligations a heavier burden as well as issuing new debt obligations. It's a catch 22, the states need help now more then ever, and they are facing higher costs pushing them closer and closer to default.

MUB is one investment vehicle to play this trend on a short trade.

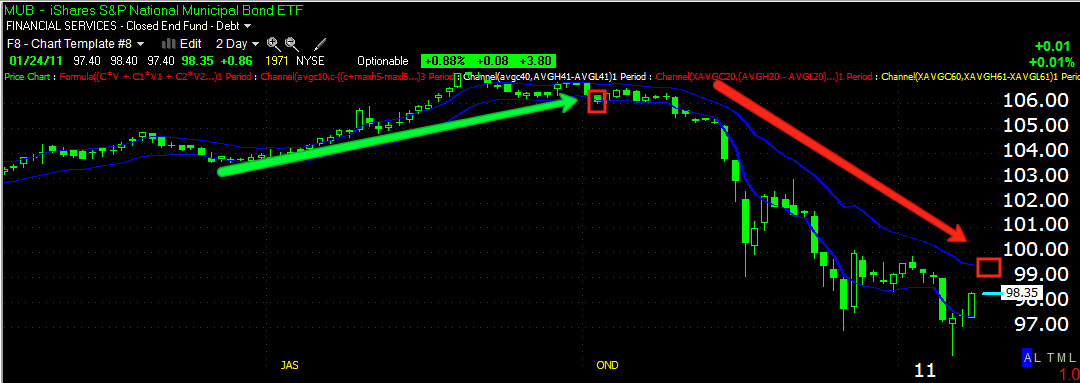
 Daily chart of MUB

 Daily 3C chart of MUB with a negative divergence at the top.

The green arrow shows the trend channel holding the uptrend for 3 months, and thus far it's held the downtrend for 3 months. The current stop is about $99.49 and MUB is rallying today, the closer you can enter MUB on a short trade to the stop, the better the risk:reward ratio will be.

There are many other bond funds/trusts and even a few state specific like California and New York. If you are interested in some others, feel free to email me.

GOOG/BIDU

At lot of you don't have time to look at charts all day, I do. So you may be focused on what the averages are doing, but there's a slew of stocks that are bellwethers that give a more internal set of metrics. Looking at two of them this morning, GOOG and BIDU, both are showing deep problems.

 BIDU 60 min chart-note the volume.

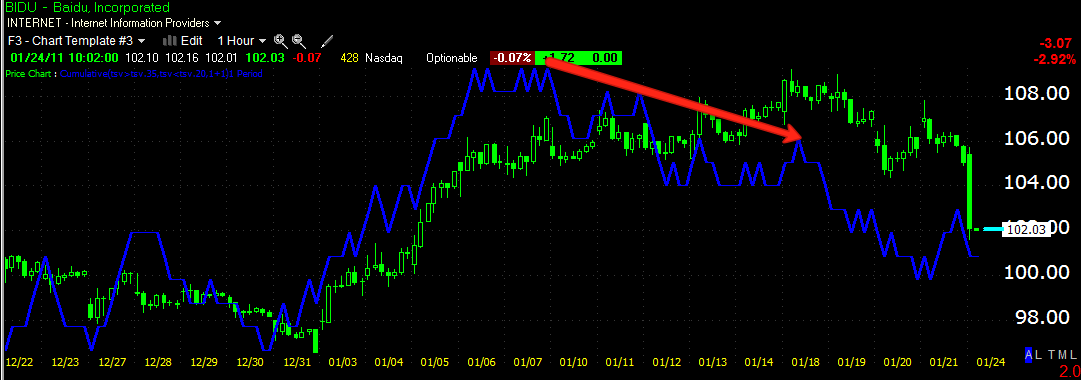
 BIDU 60 min 3C chart, note the negative divergences at the top.


 GOOG's 15 min 3C chart, over the last to days it's lost about 37 points.


 Looking at the same GOOG 15 min chart (this is why you compare as many charts as you can-you're looking for that which others miss) note the tweezer top candlestick formation/reversal formation in the red box. Also note the volume.


Check out this Heiken-Ashi price chart with Volume at price and Bollinger bands. The yellow arrow candles are indecision candles, much like traditional candlestick charting, they often serve as reversal candles. The red candle is a very strong down trend candle. Unlike candlestick charting where a long lower wick can be bullish, in Heiken-Ashi charting, the lower the wick, the more bearish the candle.

I'll be checking more charts and answering your emails, but these two market leaders are looking pretty bad right now.

Sunday, January 23, 2011

BEHIND THE TRADE

As I mentioned in my last post, there's fewer bullish looking charts right now then bearish (at least per my crossover scan-with very recent results) however, that is often a sign that the market may be overextended or oversold. We saw a very mixed market on Friday with the Dow performing the best at +.41%, the S&P at +.24% and the NASDAQ 100 which was the most dominant in terms of percentage change coming in at -.78% so the market may in fact be oversold and divergences between the 3 averages of this magnitude rarely last long.

So I'm presenting the analysis on a couple of possible long trades. I'm going through the short list as well and depending on the market, I may put a few out there as well.

LXP- This one is the exception as it is a short sale trade so we'll start with this.

 LXP has trended right into a large triangle. Smaller triangles are usually consolidation patterns, but when they are large (and this is a weekly chart) they tend to function as tops or bottoms depending on where they're found, this would be in the top category. Volume looks right, including the recent negative spikes. MACD looks right as well showing a loss of momentum into the highs.

 Here's the daily 3C. First a relative divergence in May of 2010 produced a two month sell-off, right now the divergence is even sharper and leading, things have gotten a lot worse since the last divergence.

 I checked Don Worden's MoneyStream to confirm, it confirmed both divergences as well.

This price chart (price representation) is not candlestick, it's Heiken-Ashi which is a bit different from candlestick charting and typically easier and more reliable in spotting trends and changes of trend. We'll get to that later, more importantly is the Bollinger Bands around price as the volatility has narrowed dramatically, this almost always precedes a big directional move. Also note the indicator on the left side showing "Volume at Price". It's obvious there's been a lot more sell side volume in this triangle then buy, again another reason to believe this is a top and not a consolidation.

However, let me say this and this may work out for some of our options players. We've seen the high rate of initial pattern failure on easily recognizable technical patterns. You can get the programs that find them for free, Wall Street certainly has more sophisticated black box modeling. These patterns often give a false signal before following through on the ultimate direction. So in this case,  I would not be surprised at all to see an upside breakout and that breakout turn out to be a failure. However, the upside breakout may be excellent positioning for a short side trade either via equities or options.

CCUR Long
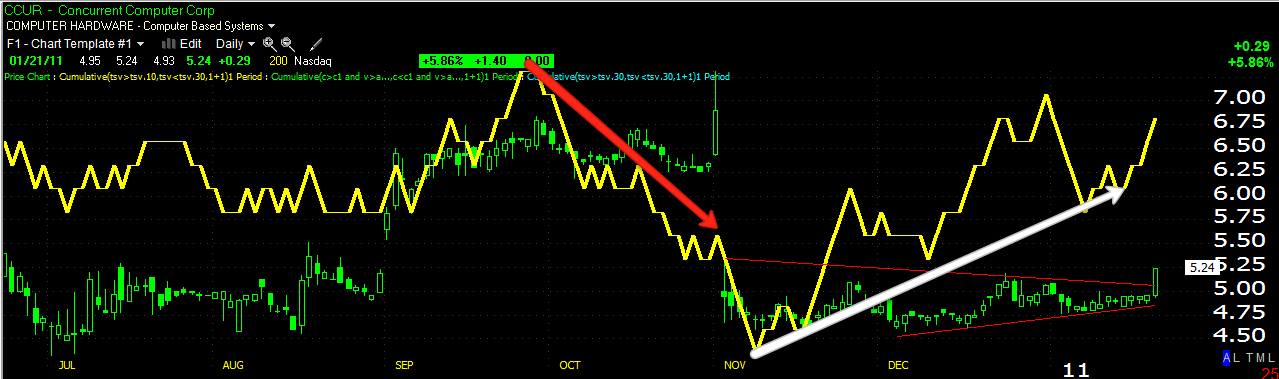
 Here's CCUR's daily 3C chart, there's a triangular consolidation, again it's large so it is probably a base.  This is speculative as the volume is so low, it's also probably a solid pattern as the low volume makes it not worth it for the black boxes to try to manipulate it. Remember the volume makes this highly speculative. 3C showed excellent accumulation into the base on the daily.


 Here in red we see the end of stage 4-decline with a capitulation event. It looks like at least a small stage 1 base is moving toward stage 2-markup.

 The 30 minute chart also showed heavy accumulation into the making of that base, right into the breakout.

 You can see, Bollinger bands have squeezed in the past right before a strong directional move.

This is the same Heikin-Ashi chart I mentioned earlier, it is read differently then candlesticks so ignore what you know about candlesticks. Basically a strong chart pattern will be big green candles with large upper wicks. Bearish candles are large with long lower wicks and indecision or reversal candles are similar to a candlestick doji star or small body candle with long upper and lower wicks. Note that the last run started with a candle almost exactly the same as the candle from Friday and gained strength from there. I like the idea of this trade, just beware of the speculative nature due to a lack of liquidity.If you get involved, managing this kind of trade is a bit different, so please keep in touch with me.

HEV
 HEV daily 3C chart shows some heavy positive divergences in the lower part of that trading range which looks a lot like a type of inverse Head and Shoulders bottom.

 This is a 15 min chart showing the pullback after the recent spike up, the divergence recently is very positive and leading. It looks like this one may be getting ready for another leg up, the base is large enough to support it.

 The white area is where I'd have my order to buy and the red line is where I'd have a stop just a little below. The respective levels are around $4.45 and $4.17. I think the risk in this trade is fairly low and the upside is looking pretty good, therefore I like this trade a lot right here.

I'll be adding trades this week, all week starting tomorrow. You'll find these trades on the list as well as other recent trade ideas featured.

Have a great week.

More Hints on Market Breadth

Many of you have seen my posts on market breadth, summed up as the internal health of a rally. Because of weighting of the averages, buying a handful of stocks can close the market in the green even though there may be a majority of stocks closing in the red. Market breadth is a longer term study of these kinds of metrics. We've seen some consistently bad and in some cases worsening market breadth. Last night and today, I took advantage of my Worden affiliate status and ran a few scans in their new TC2000-beta (version 11 of TeleChart) which will be coming out soon.

I specifically ran scans on my crossover screen which you may have seen, it looks like this.
In the top pane is a 10-day simple moving average in yellow and a 22 day simple moving average in Blue. The middle window has a custom cumulative indicator in yellow and a 22 day moving average (of the custom indicator)  which acts as a signal line. The bottom window has RSI 22 in white (note it's about 50% longer then the standard RSI most technicians use), the yellow trendline in that window represents "50" for RSI and there's a MACD Histogram. The purpose of this screen is to weed out false moving average signals of whipsaws which are a big problem for any moving average based signal system.

On the chart above you can see there was a downtrend, all 3 indicators called it a downtrend and it lasted  4 months without a single false signal suggesting otherwise. The white boxes you see are showing all 3 necessary components for a long signal, in the top and middle window, yellow indicators must be above blue and in the bottom, RSI must be greater then 50. The reverse is true for a short signal and this can also help with trade management.

So I ran two scans looking for crossovers on Friday, both for long and short positions. I used all US common stocks as my watchlist and after I completed the scan, I went through every symbol and looked for good, healthy trending stocks like this. I prefer a smooth transition such as this to a stock that is long for a few weeks and then short, they don't make for good trending trades.

After culling my list down, I came up with 63 stocks that looked promising as potential short candidates and only 5 that looked the same as long candidates. Many of the stocks having showed up on the long scan were doing exactly what I don't like and had made numerous crossovers in the last month or two. Many in fact were simply crossing back over due to volatility associated with tops and thus would not make for suitable long candidates. Here's an example of the kind of chart I'm talking about.
As you can see there were two long signals followed by the most recent on Friday, the cross-down was not a true short signal and the volatility seen in the white box probably explains why we are seeing a crossover now, but that doesn't make this stock a good trending candidate such as what we see above in EEE.          

Although this is a day's worth of data, I think it may be indicative of another aspect of the market's breadth. For WOWS subscribers, I'll be checking out the candidates with 3C and I'll be adding them to the January trade list. The majority of these trades will be longer term in focus. Other scans will be used to find additional long possibilities.