


7 years ago


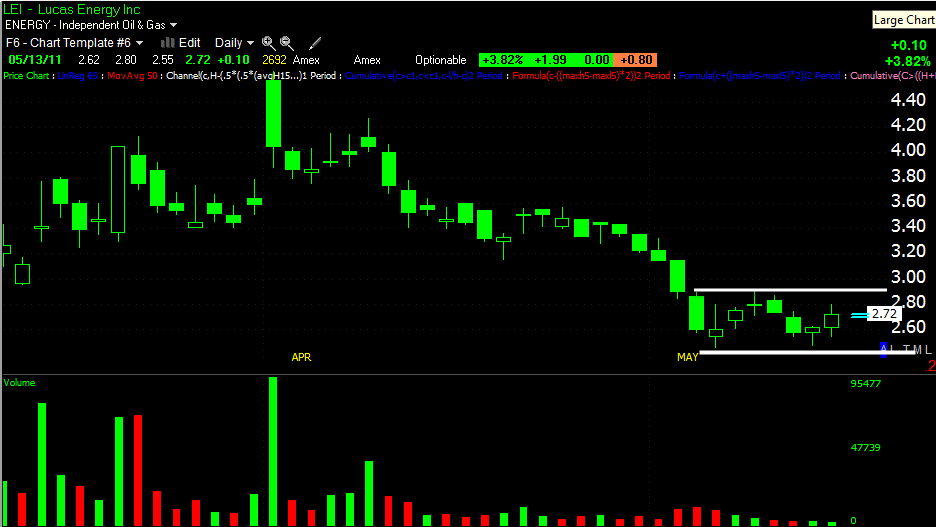
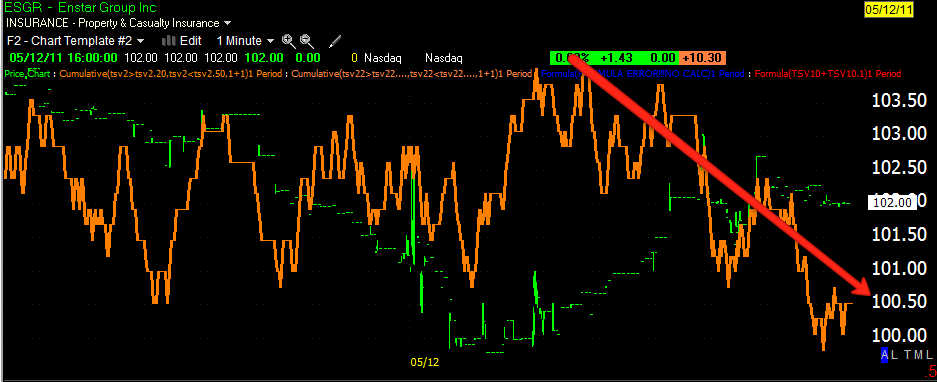 Every one of these I’ve covered has shown selling/short selling before they happen
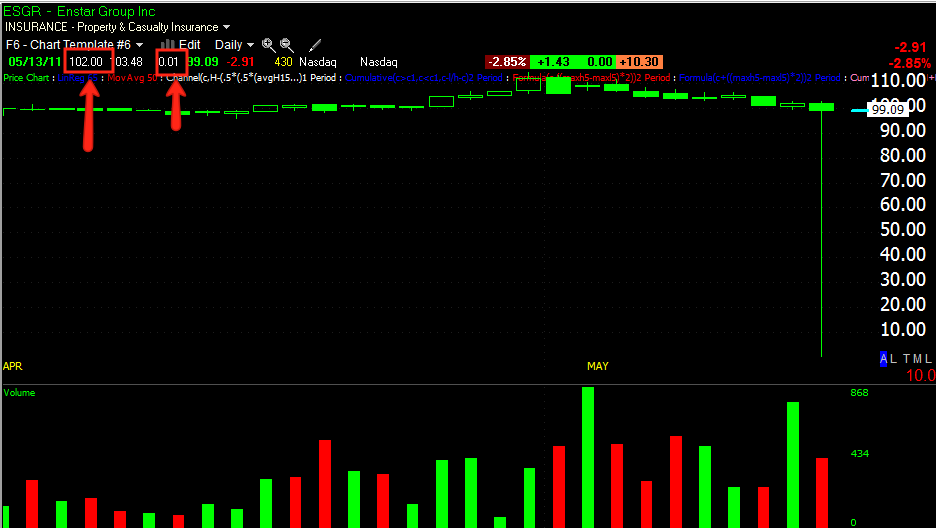 Here’s the daily chart of the crash from $102 to $.01 and the recovery back up to nearly $99.
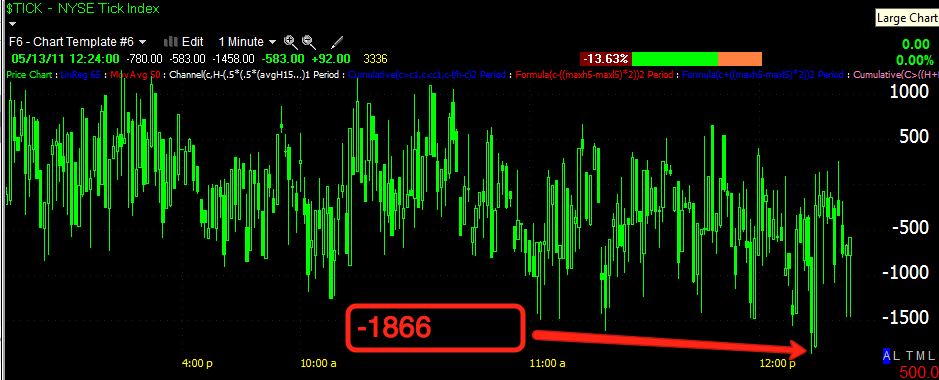 This is an earlier tick chart from today when the market bottomed, the lowest reading was -1866 which is VERY low, recently on down days a low reading has been around -1250 so to see sub -1500 was pretty unusual.
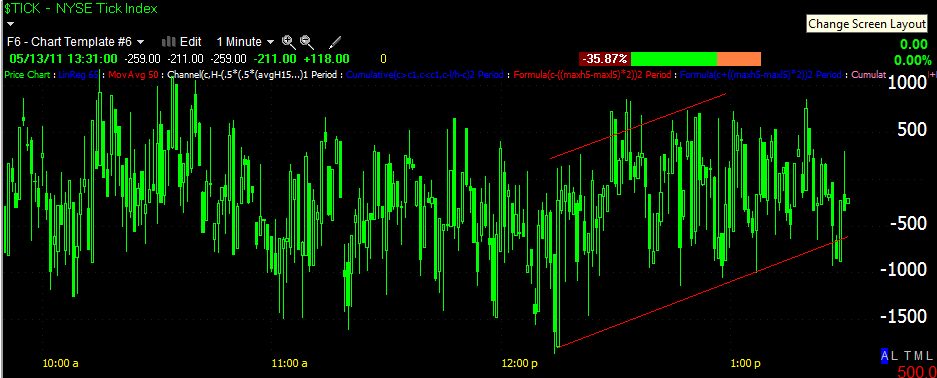 This is the most recent Tick chart captured, remember that this is all NYSE stocks. Notice how I’ve drawn trendlines around the highs/lows. Once the Tick chart moves above +1000 you usually see a pretty decent move up. If the trend line is broken, then you know the trend is about to be broken. Then you simply can draw the next set of trendlines. It’s not a perfect indicator or one with an especially large lead, but it’s useful.
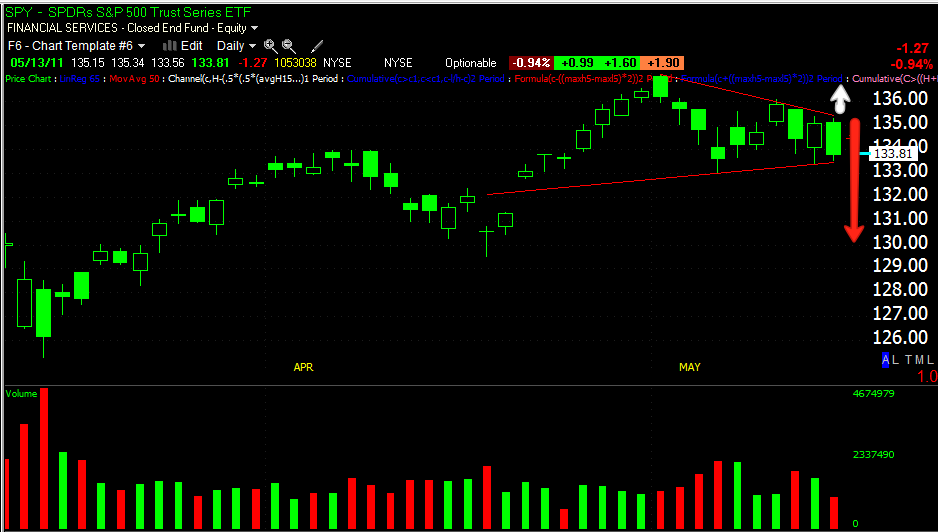 In the micro view, this is what the market has been doing with these triangles before reversing, so this is what I’ve been looking for, a run up above the upper trendline at the white arrow, then the drop at the red arrow, it’s all part of the “snowball effect” I’v described.
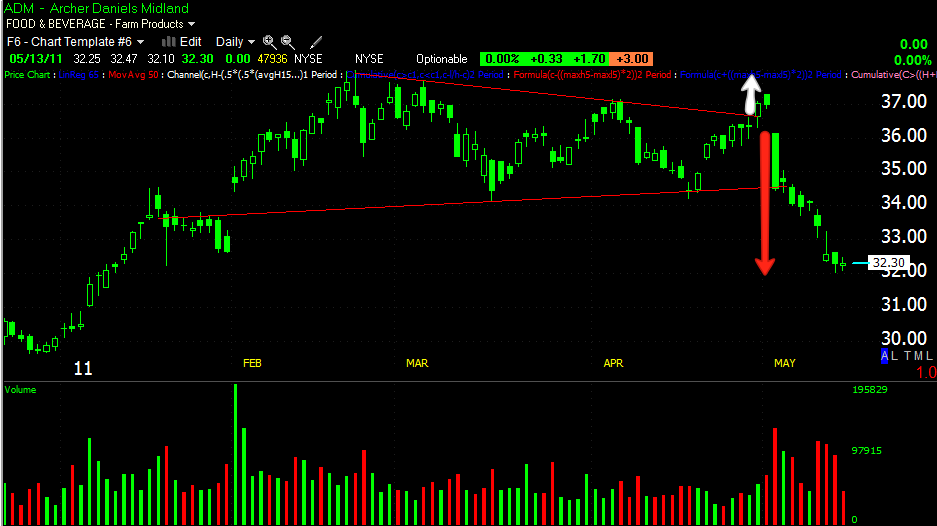 Here’s the example I mentioned yesterday in ADM, we have the triangle which is very obvious, the 2 day break above the triangle and then the snowball effect as it falls fast and hard.
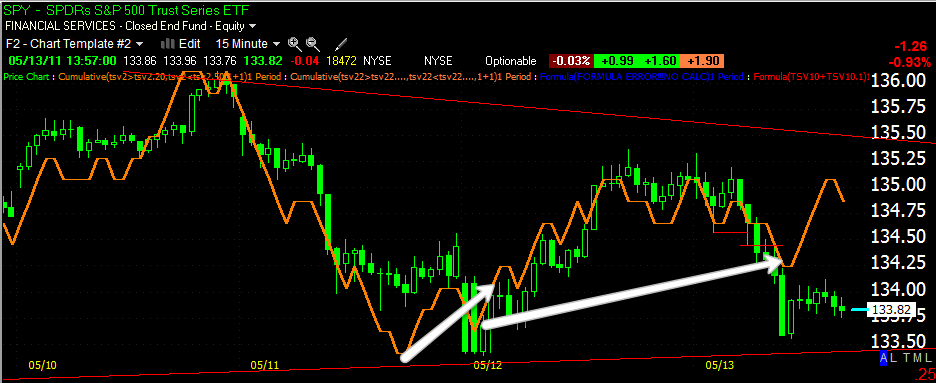 From this 15 min chart, it appears the SPY wants to do this, looking at the last time the SPY challenged the lower trendline we saw an accumulation period that ran prices up, but our triangle was not as well defined then and it certainly wouldn’t be as easy then as it is now with a much narrower apex of the triangle (less distance to travel to create a false breakout). However, tme is growing short as this triangle will most likely produce a very directional move shortly as the apex is nearly complete (similar to a Bollinger Band Squeeze).
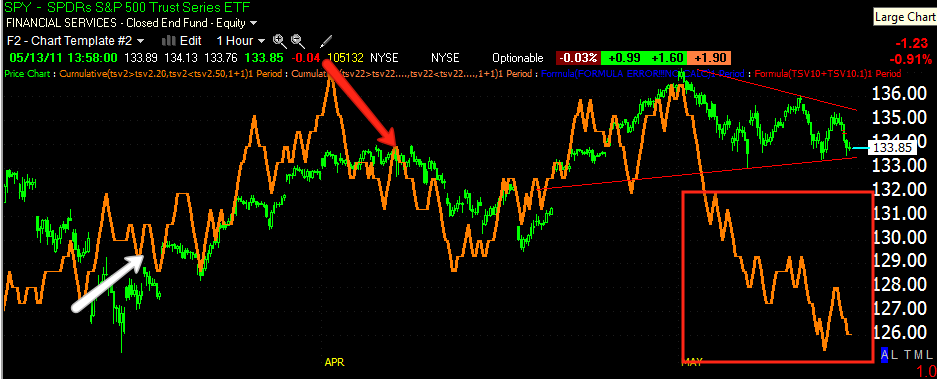 This hourly chart is showing a leading negative divergence in the SPY triangle, this is pretty ugly and puts the odds of a sharp breakdown out of the triangle pretty high. As you can see in the past, 3C on this chart has been reliable with accumulation zones sending prices higher and distribution zones sending them lower. There’s another accumulation zone not marked on the chart right before prices moved up into the triangle, you may be able to see the divergence. The leading negative divergence on a 60 min chart is about as negative as you get.
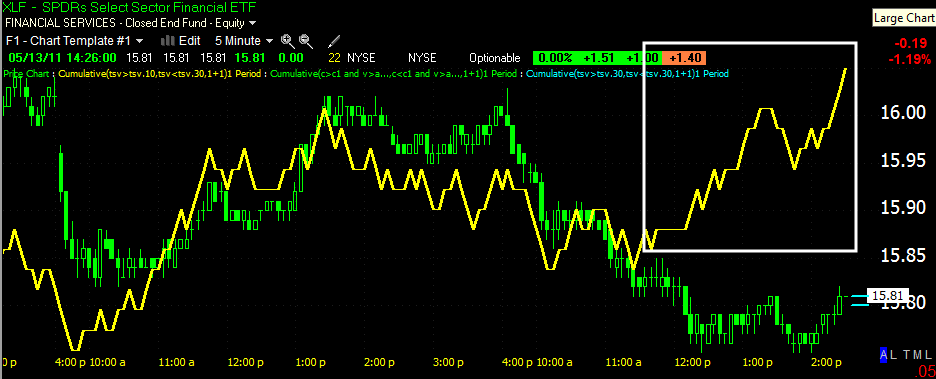 XLF 5 min chart looking pretty strong
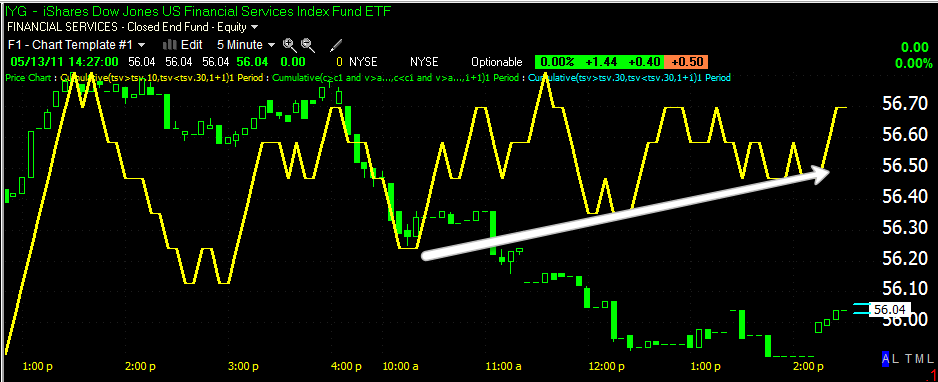 Another financial, IYG 5 min looking strong, not quite as strong as XLF, but remember that IYG has been underperforming the XLF the last 2 days.
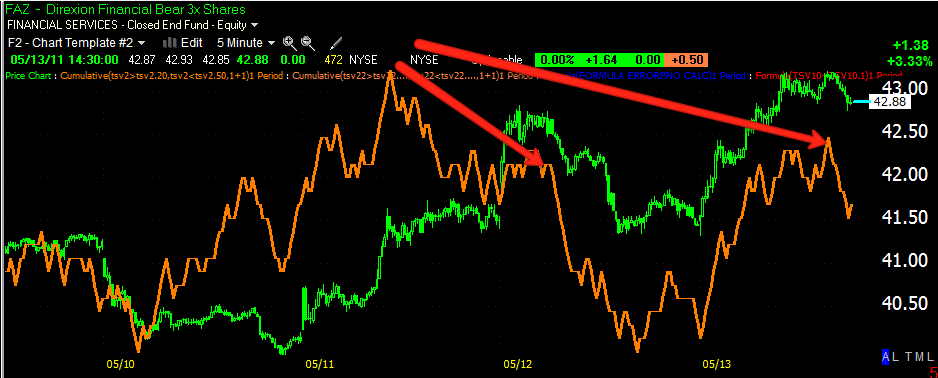 FAZ, a financial short or inverse is breaking down a bit
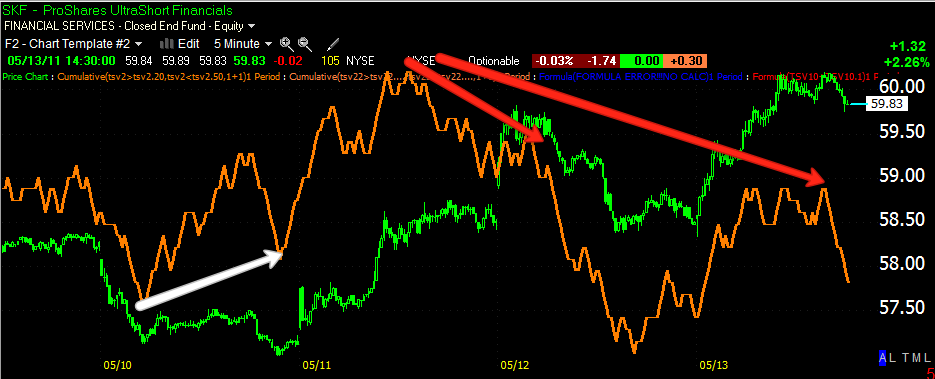 SKF is another financial short or inverse ETF and it looks largely the same as FAZ above. So there’s 4 charts that are all more or less pointing in the same direction, Financials to gain ground, which should lift the S&P


Wolf on Wall Street is powered by  | Theme by Thur
