Monday, July 25, 2011

Market Update

I want to get ths out, then I'll follow up wth the rest of the post. Last night in a thin market, Futures were anhilated, implying a market about to fall off a cliff, it was a total farce and similar to what Cramer talks about in the video I posted. I'll follow up showing some of the futures from last night and how they were used to absolutely slaughter the sheeple.

Here's the SPY now.
 Here's a 5 min positive divergence on the open, it's no wonder the market moved up to fill the gap, remember I showed hints of accumulation in the Q's and DIA at EOD trade Friday, it seems a bigger plan was already in place.

 Here's  a 3C 10 min relative divergence on the open this morning, meaning locals bought the gap down and have been riding it up in a mini short squeeze from last night's horrible futures.

 The 30 min chart is still very negative and I view this as a short term tactic on the upside, as you recall last week I was expecting the DIA and QQQ to breakout before we saw a reversal; the Q's managed it, now sectors important to the Dow which were out of rotation late last week are suddenly in rotation today.

 The 15 min chart is clearly negative, thus the shorter term positive divergences are tactics, not strategy, the market is still in a dangerous spot, but the game must be played and the game is almost always a head fake breakout before a reversal.

 Here are two possible breakout points for the SPY, but I think the DOW is the bigger issue.

Here's the DIA and the breakout point, about 120 points or so away, still very doable.

Watch for the second part of this post.

An Example

This is an example of what Jim mentions in the video and what I mentioned about accumulation zones and locals spending some money to lower a stock back in to the accumulation area. Here's EDZ which came out of a bullish descending wedge and started trading laterally, which is an indication of building a base, even without 3C.

 This daly chart shows a lot more positive divergences then negative, it is an ETF that's been building a monster base.

However, the more detailed 15 min chart shows distribution to knock the ETF back down to levels where it is accumulated. They want to put together the position at a low average price and they can either sell some inventory to create a supply/demand imbalance or more likely, they can go short term short on the ETF making money on the way down until price s back in the area of accumulation. Jim talks about knocking down stocks and spending I think $8 or $10 million dollars to do it if I recall the video correctly, which is a drop in the bucket for a large hedge fund.

In any case, when I taught Technical Analysis for 3.5 years, I started my first class with this video. My students, once they understood what all the jargon was about, left the class severely disheartened, but I wanted to make it clear from the start what they are up against and why I don't watch CNBC. One they understood that all the Wall Street propaganda they've been sold over their investing lifetimes was a bunch of bull-carp, they could better align their thinking with the true nature of the beast. You must know your opponent. As it has been said, "Keep your friends close, keep your enemies closer.

Cramer in his own words...

I'm getting a lot of requests for the Cramer video which was on the Street.com's Wall St. Confidential hosted by Aaron Task. If you watch Aaron, he clearly gets a little uncomfortable with Jim's candidness. I think Jim Cramer is a smart guy and well connected to Wall Street, especially being GS alumni.

To put the video in context, this was released before APPL came out with the Iphone, you'll here a reference to a false rumor that is hypothetically floated about AT&T not wanting the phone, which was a major undertaking for AT&T to upgrade their equipment to handle the Iphone capability, so that gives you some sense of the time frame.

I just don't trust a word Jm says on Mad Money, I think he's carrying water for Wall Street and I've had major market tops called wIth 3C in which he was telling hIs viewers to buy, he's smarter then that, but it helps his Wall Street buddies unload a position in to demand that he creates. Furthermore, how often do you hear Jm talk about shorting a stock? You have to understand what CNBC is and what Mad Money is, they are a business, they aren't what many people assume them to be. As a business, when a CEO comes on and speaks, it's a paid infomercial more or less. If Cramer said short XYZ, do you think that EO would pay money to come on the show to have his company showcased? Remember, it's a business that derives income from advertisers and Cramer's friendships and connections are a lot stronger with his Wall Street friends then they are with his viewers. Just try to read the diagonal disclosure on the show! That alone should tell you something.

However, this is Jim taking the bait and opening up about the true nature of Wall Street. He even says in the video, "This isn't something I'd say on my show", meaning Mad Money. He also says if Fund managers aren't willing to "play the game", meaning engaging in tactics that fall along the gray lines of the law, "then they shouldn't be in the game."

One other concept is something you see on 3C charts often, in a lateral accumulation range you see negative divergences near the top of the range, that's Wall Street putting some money out to knock the stock back down so they can accumulate. Jm talks in some depth about spending money to knock the market down so they can profit from the move, this s the same concept as what you see in 3C charts.

So here's the video, make sure you watch and bookmark it because it's getting harder to find, it may just disappear one day. I think Cramer regrets giving the interview in retrospect.

HERE'S THE LINK

URRE Long Trade Idea Follow Up

URRE is a long trade idea with a long term outlook.

 URRE daily bullish price pattern

 3C VERY bullish 3C pattern.

The recent pullback in URRE. I would consider accumulating some URRE on this pullback, maybe not a full or even half position, but a little as it remans very bullish in the intermediate/long run and I believe even in the short run. This is one of the few stocks I think will rally during a stock market bear market environment.

Early Market Update

Whenever I call a post an "Early" Market Update, it generally means that the market is working through retail limit orders and retail traders and we have very little view of what the locals are really up to, other then fleecing the retail traders as is common practice in the morning.

The futures were down so far late last night, it's no wonder we are seeing a move into the gap. Retail traders almost certainly placed limit and market short orders before heading off for work Monday morning, after seeing last night's futures activity. I didn't bring you news of the future activity because it was in a thin market and not during market hours, thus it was very easy to manipulate and was likely being manipulated to run a play like we see in which the shorts are squeezed on a gap fill. As far as futures go, I almost never trust them and it's the best advice Cramer has ever given, but yet wished he had rather kept his mouth shut. Contact me for the video link of how Hedge Funds and others use the futures to manipulate the market.


 The DIA with a 1 min positive divergence on the open, it's starting to lose some steam, but between what was bought on Friday near the close and what was bought at the lows today, this gap play is already profitable for the locals.

 We see the exact same in the QQQ, average prices of Friday's EOD accumulation with this morning's opening prices, makes the gap play a profitable way to start Monday morning for the locals.

The SPY showing accumulation on the gap lower and it seems to be running out of steam. Remember, price can do 3 things, go up, go down or consolidate sideways. The loss of 3C momentum doesn't mean a reversal, it could lead to a lateral consolidation. Either way, it's still too early to see institutional movement, but as I stated Friday at the close, the market is in bad shape, we are close, if not at a reversal.

GLD/SLV Update

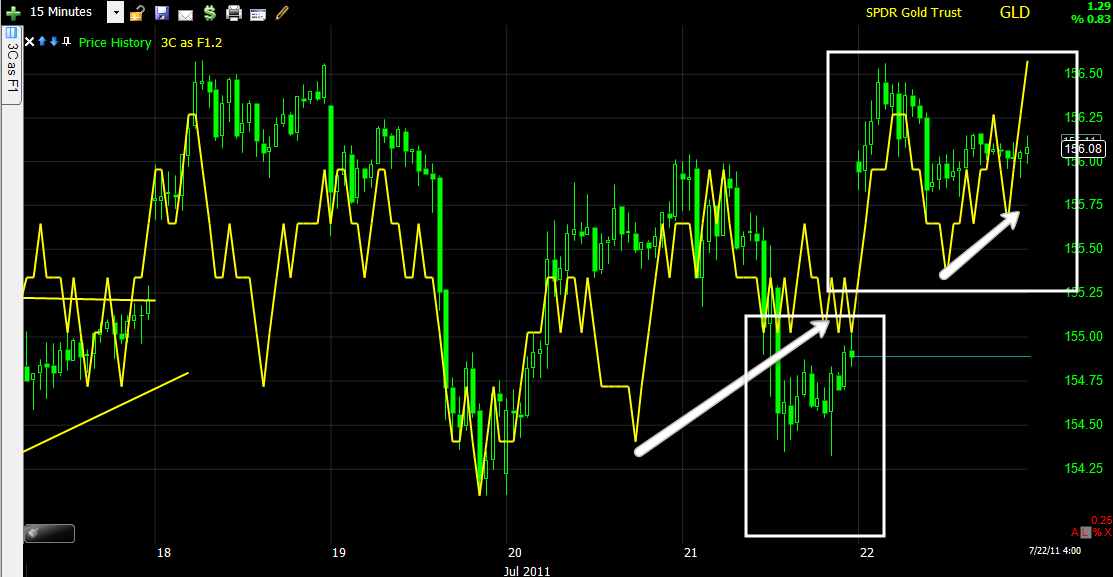
Last night you saw the GLD 3C charts

Here are this morning's relevant charts thus far...
 GLD 5 min negative divergence, GLD slips from the open.

 GLD 2 min leading negative divergence, this timeframe doesn't have lasting implications, but it's very negative disposition this morning fits well with the pullback in GLD since the open, there's an element of "sell the retail gap up".

 Here's GLD 1 min. also in a relative negative divergence, thus GLD has lost about 25% (as high as 33%) intraday and why last night I said I felt Gold would be a volatile and likely fruitful trading vehicle, but you must be able to watch it and move quickly in and out. I don't see this volatility letting up until the debt talks are resolved.


SLV
 SLV hourly chart is also still negative.

 As is the 15 min chart, although not severely so as we see in some of the major market averages.

 The 10 min chart negative on today's move higher. I feel we will see similar volatility in SLV  and GLD this week.

 Like GLD, SLV saw a 5 min negative divergence on the open, preventing it from moving higher and pulling price back.

The 1 min chart shows the same. I think the move in precious metals was overdone on limit orders this morning and we are seeing the Wall Street locals taking some of the excess retail speculation out of the game. I believe these two ETFs will see much more volatile moves and can and should be traded on a short term basis, taking advantage of that volatility.

I'll let you know when I see the next trade coming.

USO Update-

USO sticks stubbornly to support for a 3rd day, but refuses to move higher off the breakout move of Thursday of last week.

 This is the daily chart's bull flag with a 3-day long breakout above the top of the flag consolidation. Last week I mentioned that flags like USO typically have 5 points of contact before they breakout, as USO did.

 This is this morning's trade so far, once again testing support and finding support at the top of the bull flag.

 The 30 min chart suggests this breakout won't last in the near term.

 The 10 min chart agrees

 Yet the 5 min above and 1 min below show continued positive divergences at support.


Perhaps USO is waiting for  move is the Dollar Index, I really don't know why it's persistently sticking to support, but refuses to improve higher. Based on 3C, I've had a short term bearish view, but an intermediate term bullish view.

Sunday, July 24, 2011

GLD Volatility and Volatility

 GLD positive divergence Thursday late afternoon and most of Friday (15 min)

 The bigger picture still implies volatility in GLD, rather then a newly emerging trend, this should be a bumpy few weeks with swing trade opportunities. (hourly)

 Bigger picture in GLD (daly)=volatility.

 VXX is back as a buy (15 min)

VXX 5 min.

Key word, "Volatility", should be good for swing trading in both GLD and VXX.

Monday

Well it's too early to tell what Asia is doing, but we had some interesting closes on Friday.

 Dia end of day 1 min positive divergence.

 DIA close to a head fake breakout

 QQQ EOD 1 min positive divergence

 QQQ successfully broke resistance, opening the door to a head fake reversal.

IWM showing distribution EOD Friday

 SPY showing the same.

 The 15 min chart of the SPY has enough distribution now to call for a reversal of the bounce.

Euro/USD opening.

Both the DIA and QQQ traded higher in Friday after hours trade, I suspect that's what the divergence was about, however it could also be the DIA still wanting to breakout before a reversal. Ether way, I started adding shorts on Thursday and Friday as I mentioned. The market is in a bad place right now.

Last week we saw strength building in the $USD and weakness n the Euro, this s bearish for the market. Whether the DIA n make it to a breakout or not, I feel we are close enough to start acting on a reversal to the downside as mentioned Thursday and Friday of last week. The disposition of the SPY 15 min chart is bad enough to start looking for the reversal which I think will be here early this week.

As of right now, the Euro is trading at $142.92, close to the open of FX trade this week (green arrow). The Q's, DA and SPY are all negative on the 15 min chart and most are negative up to the 60 min chart indicating distribution is well under way and may in fact be complete, which would lead to a reversal.

As usual a lot can happen overnight, but the intermediate trend makes me a lot more comfortable taking on short positions which have largely been ETFs such as SQQQ, FAS, EDZ, SPXU, UDOW, etc.

The debt celling talks will be a dominating factor in this week's trade.

The Miners Trading System

Still no changes, both systems 1 & 2 re still long NUGT.