Wednesday, July 27, 2011

Perspective part 2

I should have included these longer term charts in my last post as to why I've been short since last Thursday and why I'd use any strength to short in to.

 DIA

 DIA

 QQQ

 QQQ

 SPY

SPY

Perspective

I'd still be using any strength to initiate and add to shorts.

JUST LOOK AT THE SELLING THAT OCCURRED

 The white arrow is around the time the averages broke support, the NYSE TICK data hit sub-1500 readings, that almost never happens. Talk about a shakeout.

I'd look for them to target the 50-day moving average as seen here.

Market Update

In my last market update covering the SPY I said,

"I'd keep an eye on this... remember accumulation is generally in flat zones."
and after showing this chart...


"Support area, although it could certainly break that to surge volume on a head fake."


Well, that's what appears to have happened, exactly...
 DIA break of intraday support, volume surges, a perfect head fake set up for a bounce. The break down is obvious to all technical traders, they're going to short it, when prices move up, they're squeezed and add to the buying pressure when they cover.

 This is a relative positive divergence, measured between two relative price points, the second being lower then the first, but 3C is at least even if not slightly higher (5 min )

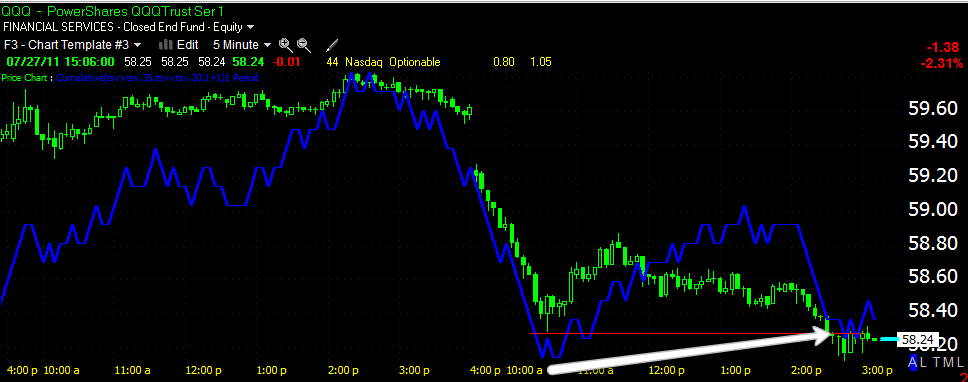
 Here we see the same support in the Q's broken for the same reason.

 and a 5 min relative positive divergence. If 3C was confirming the trend, it would have moved lower.

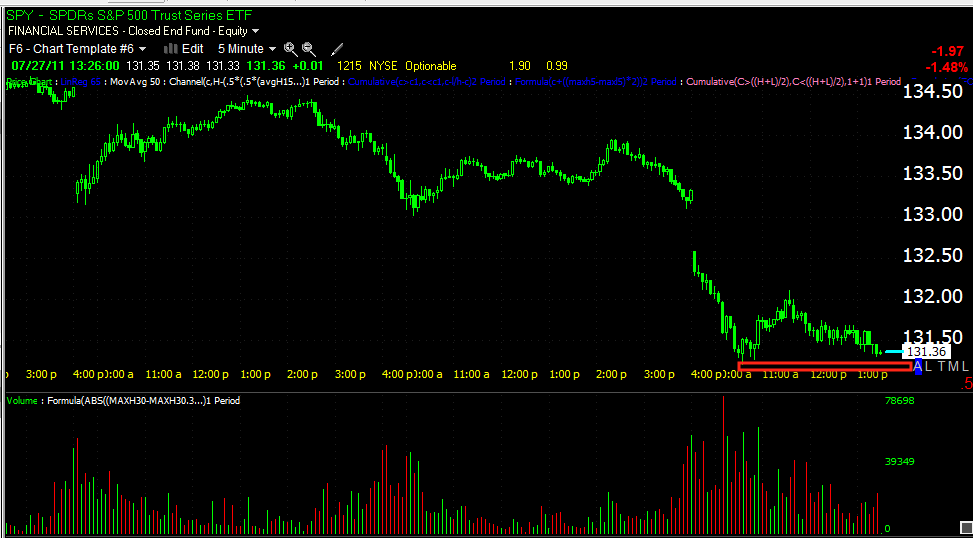
 And here it is in the SPY, causing volume to surge.

 The 5 min divergence here is stronger and in leading position.

We even have a 10 min positive divergence.


I believe the same thing is even happening in MCD as I warned in the MCD post.


All in all these are not huge divergences, but they have lasted most of the day. I think they have the capability of lifting the market.

Trade Idea-ERY (Long)

Honestly, USO hasn't shown much clarity whatsoever, except for the longer term charts. I have maintained my view that USO would pullback, likely be accumulated and then make a real breakout through the flag, something it has failed to do. In the meantime, ERY has much more clarity then USO (inverse 3x leveraged short on Energy). I like the idea of a reasonable size position in ERY for at least a swing trade and then we'll see what happens from there.


 We've seen these false breakdown all too often before a reversal, they always target a well defined area that technical traders will identify with.

 3C hourly on the breakdown below support suggests the move was a shakeout/head fake

 As does the 30 min.

Since the hourly Trend Channel has worked well with swing moves, I'd consider using it as a trailing stop.

MCD short trade follow up

We took out a short trade on MCD on 7/22 based on this post

Here are the charts...
 This short was after MCD's earnings pop and at the red arrow.

 The daily chart looks bad so I think MCD will start topping soon, which is usually a volatile affair.

 The hourly chart was telling us there would likely be selling into the gap up, which there has been.

 The 15 min chart helped us time the entry.

 However, as you can see now there's a bullish descending wedge, that looks ready to make an upside move, we may see a downside head fake first.

 The 15 min chart recently is positive, combined with the wedge, I think up is the short term path of least resistance.

The 5 min chart shows the move is close.

Personally I'd take the small profit here and re-establish the short at higher levels. The disposition of the longer term charts look like MCD has reached a top, but with these signals, that doesn't mean we can't see some counter trend volatility to the upside.


Let me know if you like these smaller charts better. Remember you can always click on the chart for an enlarged view.

Trade Idea-SRS (long)

Is SRS finally going to catch a break?

This has been theoretically one of my favorite trades considering the real estate market, but it just hasn't caught an updraft, that may be changing.
 On the daily chart, there's a huge bullish descending wedge, volume s correct for the pattern.

 The daily chart has also shown a significant positive divergence, especially recently.

 Here the hourly chart confirms the recent positive divergence.

 The more detailed 15 min chart shows a turn down from the range highs on distribution and a positive divergence in SRS.

Here's the first hurdle-resistance near $14.20. Note the swing trend classification of the last 3 days making higher highs/higher lows and today a 3.4% advance on increasing volume. If SRS can break out finally, the long term price pattern implied target is anywhere between $30 and as high as $60+

As a swing stop, you might consider the 60 min Trend Channel which has held all of the swing trends in SRS. The stop would be in the area of $13.60-that's not bad risk/reward. If SRS can perform, we'll have to widen the stop.

Treasuries/TLT Update

Lets not forget TLT which looked a lot like GLD yesterday, here was the short term call from yesterday...
TLT's Intraday Action

Here was the short term TLT chart from yesterday's post...

And today's reaction...
 Today's intraday fall from yesterday's intraday bearish call on TLT.

 On this 30 min chart I had warned previously twice about pullbacks from the two areas at the white boxes.

Intraday, it looks like TLT wants to bounce. The long term charts remain muddy, most probably a result of the ongoing drama in Washington.

SPY pullback

I'd keep an eye on this... remember accumulation is generally in flat zones.

 Support area, although it could certainly break that to surge volume on a head fake.

 5 mn 3C

10 min 3C-

the longer the divergence goes on and the longer timeframes it hits, the bigger the eventual move will be. Right now it's looking like it's setting up for an intraday bounce.

Market Update

It looks like an intraday bounce is coming.

 DIA 5 min positive

 QQQ 5 min positive

SPY 10 min positive