Tuesday, August 23, 2011

GLD/DZZ Update

The last post on GLD/DZZ seems to have been a very timely call. From that post f you picked up DZZ, you are up 3.3% in less then a half hour. It's also good that GLD didn't totally fill the gap. Here's a look at GLD now.
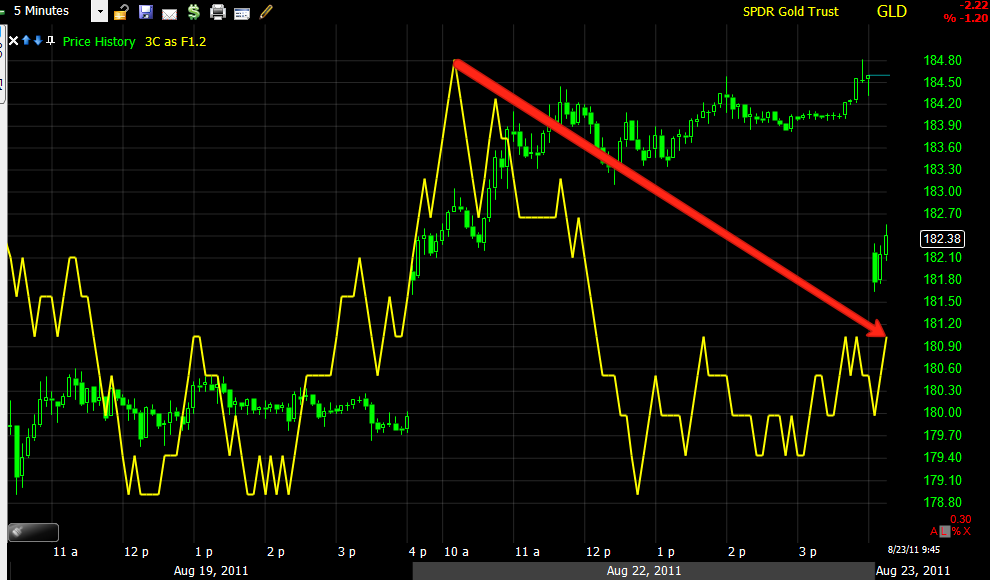
 Here's the last update at the red arrow, so far 3C is confirming GLD's price action.

 Here's DZZ, also confirmed by 3C

And the hourly chart, not only shows a positive divergence late yesterday, but is in confirmation also.

Trade Idea MCRL (long)

 This pattern is similar to the market, a "W" shaped bottom. While you could start a position here, ultimately you'll ant to see a breakout through the neck line on increasing volume around 9.80-ish

 The daily 3C chart looks very strong.

Here's a potential stop, feel free to email me about alternative stops.

GLD/DZZ Update

 GLD looks like it may be topping here as it tries to fill the gap.

 GLD 5 min

 Using this level as a potential stop, there's very little risk in the trade, so long as you use risk management guidelines.

 Here's DZZ on an hourly chart, it looks like it has been basing for quite sometime.

Here's a low risk alternative stop for DZZ. These low risk stops don't mean anything if they are not part of your wider outlook risk management mechanism. The low risk is what makes the trade worthwhile, make sure you are consistent with your risk management and use the lower risk as your edge.

SPY "W" Micro/Macro

The one interesting thing about Technical Analysis is that it is fractal, the same chart formations you see on an 1 min chart will appear on a 5 day chart.

Lets take a look at the SPY

 The 10 min chart of the SPY shows what appears to be a double bottom, last week when I warned about a sharp sell-off and it came the next day, I also warned we'd likely be looking at a formation that is most likely to be a "W" bottom and these bottoms are often head faked with a break to a new low before moving up. On the 10 min chart, volume looks good for the formation and at the red arrow, we created a new low for this side of the pattern (since Thursday's sell-off)-that served as the mini formation's head fake.
Also Note the productive pattern in RSI.

 Here's the daily chart version of what I thought we'd see,  "W" shaped bottom, we are at the lows of the right section of the "W" so a head fake in this area would not be uncommon. Also note the productive pattern in RSI.

 Here's the SPY 15 min chart, it's very positive right now for the "W" pattern.

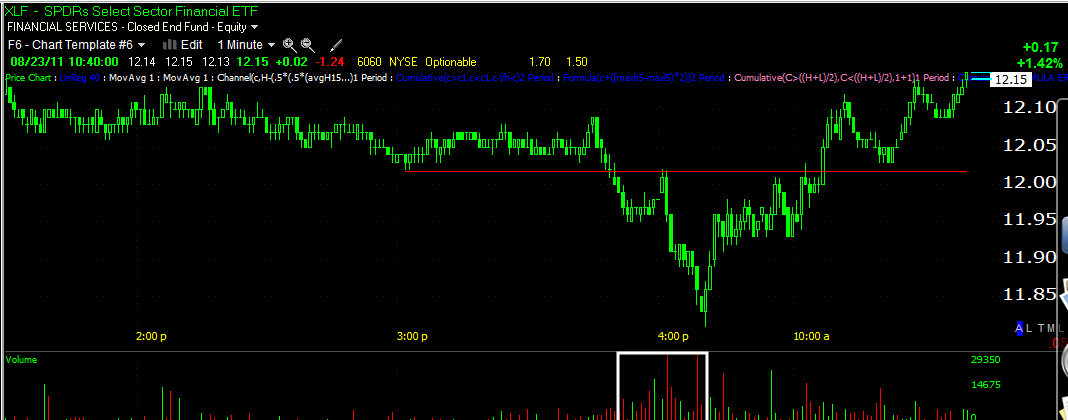
Here's XLF from yesterday's head fake, note how it triggered a lot of volume, hit stop and limit orders and now it has recovered, BAC is in a similar position, it just hasn't fully recovered yet. These head fakes can test our nerves, but they tend to be one of the best timing signals we have, so long as 3C finds them to be non-confirmed.


Silver Falls as UBS Calls For $50.00 Silver

I'm always suspicious when an investment bank starts giving out free research that they pay tens of millions of dollars for, especially when the underlying equity of interest is down.

I published this piece about the ascending wedge in SLV and what to expect from it so far it has done what was expected, and now it's starting to fall, this is certainly an area to look at ZSL.

Here are the SLV/ZSL charts.
 As far a the wedge, this was posted on 8/18 (last Thursday while SLV was still in the wedge) -Daily SLV chart.

"Here's an hourly chart of SLV in a bearish ascending wedge, most traders expect a straight drop down out of the wedge, because it is so obvious, it is likely to be gamed, so I would look for a breakout to the upside, maybe even a new local high and then a plunge in SLV, lifting ZSL. It shouldn't be long now that the wedge is so tight."

 SLV 15 min negative divergence

 SLV 5 min negative divergence

 SLV 1 min negative divergence

 ZSL 15 min positive divergence

 ZSL 10 min positive divergence

 ZSL 5 min positive divergence

ZSL 1 min positive divergence

ZSL is pulling back a bit so you may get a much better Risk:Reward Entry.

BAC Follow Up

Yesterday I mentioned some Bullish looking 3C charts of BAC, then BAC fell. It looks like BAC may have been head faked as it hit with a lot of volume upon breaking intraday support which it was just hovering over. I've set alert for it this a.m. every $.05 and they keep triggering, it's slowly moving back up.

Keep an eye on XLF as well.

Not a Bad Start

I try not to read too much in to early morning trade, but were not off to a bad start considering the averages have managed to reach the 10 min charts (positive) over the last day or two and in a rather flat trading environment.

 DIA 10 min

 IWM 5 min (there's no 10 min on StockFinder and the symbol takes a minute to load on TeleChart).

 QQQ 10 min

SPY 10 min with the relative flat range bounce market that I often mention.

Something Broke in GLD?

I've been warning that the GLD trade has been showing very weak or no confirmation for some time and said last week I though it was under distribution. Today GLD opened lower, t's down over 1% already, could this be all of that non-confirmation finally catching up?

Just about every day these harts have looked like this for GLD.

 GLD 60 min

 GLD 15 min

 GLD 10 min

GLD 5 min.

Miners Trading Signal

Both systems are long DUST this a.m., that would mean buy DUST toward the open with a 3% closing basis stop loss.

Interesting Start to the Day

The entire NYSE system is down.